
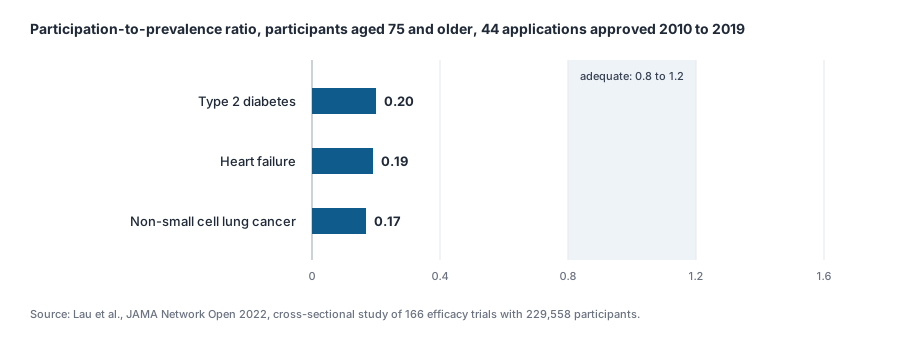
Section 1194(e)(2) of the Social Security Act directs CMS to consider the comparative effectiveness of a selected drug and its therapeutic alternatives, including effects in specific populations such as individuals with disabilities, the elderly and the terminally ill [1]. The pivotal trials of many drugs enrolled few patients aged 75 and older. In the trials behind 44 approvals from 2010 to 2019, about half of the participants were under 65 [2]. Patients aged 75 and older were enrolled at a fifth or less of their share of the disease population in three common conditions [2]. A manufacturer therefore has to build the comparative case for the Medicare population from evidence the trials did not set out to provide. This article explains what the statute asks for, who the Medicare population is and how large the gap between trial and beneficiary is. It then describes five ways to close the gap: age subgroups from head-to-head trials, pooled trial data, network meta-analysis with age adjustment, population-adjusted indirect comparison, and comparative real-world studies in Medicare data. It closes with the cost-effectiveness constraint, the structure of the response and the reuse of the same evidence in the AMCP dossier.
1. What the Statute Asks For
The comparative effectiveness factor in section 1194(e)(2)(C) names the populations in which effects matter: individuals with disabilities, the elderly, the terminally ill, children and other patient populations [1]. The same subsection closes with a limit. CMS may not use evidence from comparative clinical effectiveness research in a manner that treats extending the life of an elderly, disabled or terminally ill individual as of lower value than extending the life of a younger, nondisabled or not terminally ill individual [1]. The populations named in the factor and the populations protected by the limit are the same. Evidence of effect in older and disabled patients is asked for, and evidence that discounts their life years is excluded.
The Negotiation Data Elements form carries this factor into a question on clinical comparative effectiveness for each indication. The form names head-to-head randomized controlled trials, pragmatic trials, network meta-analyses, observational studies and real-world evidence as relevant evidence, and asks for supporting citations [3]. Each question has its own instructions on length, and visuals and citations are submitted through separate questions [4]. The response therefore has to say in a limited space what the comparative evidence shows in the Medicare population, with the study-level detail placed in the visuals and the dossier.
The comparators are the therapeutic alternatives CMS identifies for each condition. How those are chosen and how a manufacturer argues for its own list are covered in Therapeutic alternatives in Medicare drug price negotiation. The rest of the form and the submission calendar are set out in the CMS ICR Section I guide.
2. Who the Medicare Population Is
Medicare covered about 68 million people in 2024 [5]. About 61 million were aged 65 or older, and about 7 million were under 65 and eligible through long-term disability or end-stage renal disease [5]. In 2022, 45 percent of beneficiaries had four or more chronic conditions, 28 percent had a functional impairment and 17 percent had a cognitive impairment [5]. In 2025, 34.1 million beneficiaries were enrolled in Medicare Advantage plans, 54 percent of those eligible [5]. Table 1 summarizes the figures.
Table 1. The Medicare population [5]
| Measure | Figure | Year |
|---|---|---|
| Beneficiaries | About 68 million | 2024 |
| Aged 65 or older | About 61 million | 2024 |
| Under 65, eligible through disability or end-stage renal disease | About 7 million | 2024 |
| Four or more chronic conditions | 45 percent | 2022 |
| Functional impairment | 28 percent | 2022 |
| Cognitive impairment | 17 percent | 2022 |
| Enrolled in Medicare Advantage | 34.1 million, 54 percent of those eligible | 2025 |
Three features of this population shape the evidence. Multimorbidity and polypharmacy change the balance of benefit and harm, because interactions, renal and hepatic impairment and competing risks are common. Functional and cognitive impairment change what an outcome is worth, because a treatment that preserves independence or reduces hospital days carries weight that a surrogate endpoint does not. And the under-65 group eligible through disability is a Medicare population in its own right, with a different age and condition profile from the over-65 group. A response that treats Medicare as a single older population has described less than the statute names.
3. The Gap Between the Trials and the Beneficiaries
Two primary sources measure the gap. The FDA Drug Trials Snapshots summary report for 2024 covers the pivotal trials of the 50 novel drugs approved that year, with about 31,000 participants [6]. The share of participants aged 65 or older ranged from 1 percent to 97 percent across drug programs, and in the cancer programs it was 36 percent [6]. A cross-sectional study by FDA authors examined 166 efficacy trials with 229,558 participants behind 44 new drug and biologics license applications approved from 2010 to 2019 in seven conditions [2]. About half of the participants were under 65 and 8 percent were aged 80 or older [2]. The study used a participation-to-prevalence ratio, where 0.8 to 1.2 indicates adequate representation [2]. Participants aged 60 to 75 were represented in proportion to the prevalent population. Those aged 75 and older were underrepresented, with ratios of 0.20 in type 2 diabetes, 0.19 in heart failure and 0.17 in non-small cell lung cancer [2]. Table 2 gives the figures.
Table 2. Representation of older adults in pivotal trials [2, 6]
| Source | Measure | Result |
|---|---|---|
| FDA Drug Trials Snapshots, 2024 approvals | Participants aged 65 or older, cancer drug programs | 36 percent |
| FDA Drug Trials Snapshots, 2024 approvals | Range across drug programs, aged 65 or older | 1 to 97 percent |
| Lau et al., 44 applications approved 2010 to 2019 | Participants under 65 | About half |
| Lau et al. | Participants aged 80 or older | 8 percent |
| Lau et al. | Participation-to-prevalence ratio, aged 75 or older, type 2 diabetes | 0.20 |
| Lau et al. | Participation-to-prevalence ratio, aged 75 or older, heart failure | 0.19 |
| Lau et al. | Participation-to-prevalence ratio, aged 75 or older, non-small cell lung cancer | 0.17 |
The FDA has asked sponsors to enroll more older adults. Its March 2022 guidance on the inclusion of older adults in cancer trials defines older adults as those aged 65 and older and stresses enrollment of adults over 75 [7]. It asks that information on use in older adults appear in labeling [7]. For a drug approved before that guidance took effect, the trial populations are fixed, and the comparative case for Medicare has to be assembled from other evidence.
4. Five Ways to Build Comparative Effectiveness Evidence for Medicare
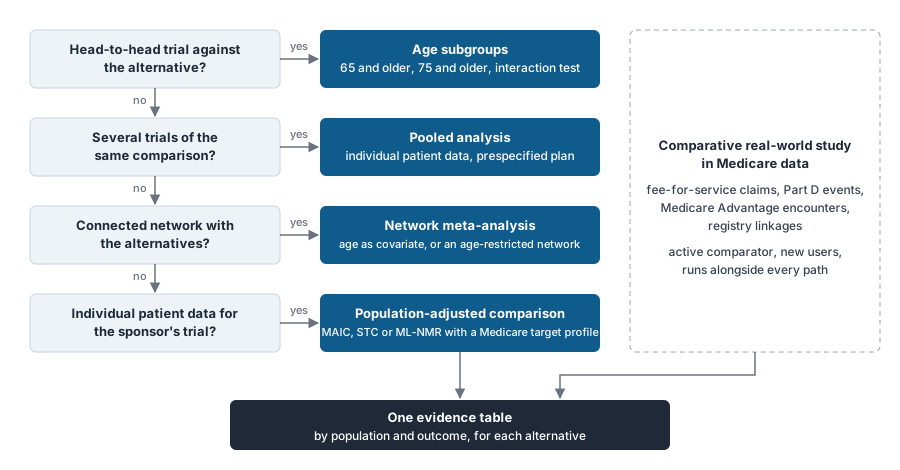
Each method answers the comparative question for the Medicare population from a different angle, and the response usually combines two or three of them. Table 3 lists them with what each shows and the limitation that has to be stated. Figure 2 shows the order in which they are considered.
Table 3. Methods for comparative effectiveness evidence in the Medicare population
| Method | What it shows | Requirement | Limitation to state |
|---|---|---|---|
| Age subgroups from head-to-head trials | The direct comparison in participants aged 65 or older, or 75 or older, with the interaction test | A head-to-head trial with age recorded and the subgroup reported or available from the sponsor's data | Subgroups are usually small and underpowered; the test for interaction, with its confidence interval, carries the finding |
| Pooled analysis of the sponsor's trials | A larger older-adult subgroup across trials of the same comparison | Individual patient data from two or more trials with compatible endpoints | Pooling across trials with different designs needs a prespecified plan and a test of heterogeneity |
| Network meta-analysis with age adjustment | Relative effects across all alternatives, with age as a covariate or in an age-restricted network | A connected network of trials reporting age, and either age-subgroup results or a meta-regression on mean age | Meta-regression on trial-level age is weak when trials span a narrow age range; subgroup networks are often sparse |
| Population-adjusted indirect comparison | The relative effect in the comparator trial's population (MAIC, STC), or in a specified target population such as a Medicare profile (ML-NMR) | Individual patient data for the sponsor's trial, aggregate data for the comparator trials, and for a target population estimate a covariate profile drawn from Medicare data | Unanchored comparisons rest on the assumption that all effect modifiers and prognostic factors are balanced; anchored comparisons need a common comparator; the covariates that could not be modeled are stated |
| Comparative real-world study in Medicare data | Effectiveness, safety, persistence and resource use in beneficiaries as treated, including those aged 75 and older and those under 65 with disabilities | Medicare fee-for-service claims, Part D event data, Medicare Advantage encounter data, a cancer registry linkage or a disease registry, with an active comparator | Confounding by indication; the design, the confounding control and the share of the cohort in each Medicare group have to be reported |
The method choice for the indirect comparison follows the rules set out in the NICE Decision Support Unit technical support documents, which allow unanchored population adjustment only where no connected network exists and ask for the residual bias to be quantified [8]. The choice among network meta-analysis, matching-adjusted indirect comparison and simulated treatment comparison is set out in MAIC, STC or NMA. Whether a connected network exists for the alternatives CMS has named is settled by the NMA feasibility assessment, which EvySaif runs on the CMS list, because the comparators chosen at launch may differ from it. The foundations of the method are in the network meta-analysis guide.
One distinction matters. A matching-adjusted indirect comparison or a simulated treatment comparison estimates the relative effect in the population of the comparator trial, which is usually younger than the Medicare population. Multilevel network meta-regression (ML-NMR) can instead produce an estimate for a target population with a specified covariate distribution [8, 12]. The Medicare profile drawn from claims is that target: the age distribution, the share with each major comorbidity, the share with renal impairment and the share under 65 with disability. The result is an estimate for the population the price will apply to, with the covariates that could not be modeled stated as a limitation.
5. Outcomes That Carry Weight in the Medicare Population
The outcomes reported for a Medicare comparison are chosen before the evidence is assembled, and the same list is used for every method and every alternative. Outcomes that discriminate between treatments in older and disabled patients include hospitalization and emergency visits, serious adverse events and discontinuation for adverse events. Falls, fractures and delirium are added where relevant to the class, with renal and hepatic events and drug interactions with common co-medications. Persistence on treatment and treatment burden, measured by dosing frequency, monitoring and administration setting, complete the list. Mortality and the condition-specific efficacy endpoint stay on the list. Patient-reported outcomes are reported with the instrument, the timepoint and the minimal important difference.
A response organized by outcome, with each outcome defined once and then reported for each population and each alternative, reads as evidence. A response organized by study, with each study described in turn, reads as a literature review and leaves the reviewer to assemble the comparison.
6. Real-World Evidence in Medicare Data
A comparative study in Medicare data is the only method that observes the population directly. Fee-for-service claims with Part D event data cover drug exposure, diagnoses, procedures, hospitalizations and death, and are available to researchers through the CMS Virtual Research Data Center, with requests made through the Research Data Assistance Center [9]. Medicare Advantage encounter data extend coverage to the half of beneficiaries in those plans. A linkage of a cancer registry to Medicare claims adds stage and histology for oncology comparisons. Disease registries and electronic health records add laboratory values and functional measures that claims do not hold.
The design is an active-comparator new-user cohort that mirrors the trial that was never run. The eligible population is defined at the point of treatment choice, the selected drug and the alternative are the arms, follow-up starts from the first dispensing, and outcomes are defined in the same way for both arms. Confounding is addressed by propensity score methods or by an instrument, with the balance achieved reported in a table. The report gives the data source and period, the cohort definition with the numbers excluded at each step, and the share of the cohort aged 75 and older and under 65 with disability. It also gives the comparator, the confounding control and the sensitivity analyses. The reporting conventions for such studies are set out in the ISPOR and ISPE good practice recommendations for real-world evidence used in decision making [10].
A real-world comparison that agrees with the trial result extends the trial to the Medicare population. A real-world comparison that disagrees is still reported, with the reasons examined, because a reviewer who finds the study in the literature will ask why it was left out. EvySaif designs and reports real-world evidence studies in claims, registry and electronic health record data to this standard.
7. The Cost-Effectiveness Constraint
The limit in section 1194(e)(2) excludes evidence that treats a year of life in an elderly, disabled or terminally ill person as worth less than a year of life in another person [1]. A cost-per-QALY analysis that uses age-specific utility weights, or a threshold that values life years differently by age, falls within the exclusion. The clinical comparative evidence described above does not. Neither do analyses of comparative resource use, hospital days avoided, cost per clinical event avoided, or budget impact in the Medicare population, provided they do not weight life years by age or disability.
For a product with a cost-effectiveness model already built for other markets, the model's comparative clinical inputs, its event rates and its resource use estimates can be presented without the QALY aggregation. How relative effects enter such a model is set out in From NMA to economic model, and the reporting standard in the CHEERS 2022 guide. The treatment of cost-effectiveness evidence within the Section I form is covered in section 13 of the CMS ICR Section I guide.
8. Organizing the Response
The response on comparative effectiveness runs in this order.
- A summary of the comparisons available for each alternative, by evidence type, with the direction and size of the main results and the populations in which they were observed.
- For each population the form or the alternatives list distinguishes, such as treatment-naive and previously treated patients, the results by outcome, with the head-to-head trials first, the indirect comparisons second and the real-world studies third.
- Within each population, the results for beneficiaries aged 65 and older, 75 and older, and under 65 with disabilities, stated as observed, with the sample size and the interaction test or the confounding control.
- The limitations of each evidence type, in one sentence each.
- A closing statement on what the evidence shows for Medicare beneficiaries in place of each alternative.
Each evidence sentence carries the design, the population, the comparator, the endpoint with its timepoint, the effect estimate with its confidence interval and the citation. Superiority is claimed only where a trial tested it and met it. A noninferiority result is reported as noninferiority with its margin. Where no study has examined a comparison or a population, the response says so. The structured evidence table from which every sentence is written, and the quality control before certification, are described in the CMS ICR Section I guide.
9. Reuse in the AMCP Dossier and in Later Cycles
The same evidence table serves the AMCP Format dossier that Part D and commercial plans request [11]. In the dossier the clinical evidence section is organized by comparator and the real-world evidence has its own place [11]. The Medicare-population results are the ones a Part D plan reads most closely. The route from the negotiation submission to the dossier is set out in the AMCP Format 5.0 guide.
The table also stays open after the submission. A drug with a negotiated price can be selected for renegotiation, and the manufacturer of a drug that becomes a therapeutic alternative to a later selected drug can submit evidence as an interested party [4]. New trial results, label changes and real-world studies are filed against the same populations and outcomes as they appear, so that the next response is an update. The program timeline and the renegotiation rules are set out in the Medicare drug price negotiation guide, and the pressure a high launch price puts on this evidence in Launch prices after the IRA.
10. Medicare Comparative Effectiveness Consultancy: EvySaif
EvySaif Research and Medical Affairs Solutions is a clinician-led health economics and outcomes research (HEOR) consultancy based in Pune, India, and one of the leading HEOR consultancies in India for United States payer evidence. For a selected drug or a likely candidate, EvySaif builds the comparative case for the Medicare population from the methods in Table 3. The work covers the systematic literature review of head-to-head and single-arm trials for the selected drug and the alternatives CMS has named, and the extraction of age-subgroup results. It includes the network meta-analysis or population-adjusted comparison with a Medicare target profile, and the design, analysis and reporting of comparative real-world evidence studies in claims and registry data. The results are written into one evidence table organized by population and outcome. The Section I response, the visuals and the AMCP dossier are written from that table by medical writers who work from primary sources under HTA and payer submission standards.
Clinicians lead the outcome selection, so that the outcomes reported are the ones that decide treatment in older and disabled patients. For sponsors in India, the Middle East and North Africa and Europe entering the United States market, the work is delivered at Indian cost levels with the traceability a CMS reviewer expects.
11. Frequently asked questions
Section 1194(e)(2)(C) asks CMS to consider the comparative effectiveness of the selected drug and its therapeutic alternatives, including effects in individuals with disabilities, the elderly, the terminally ill, children and other patient populations. The evidence can come from head-to-head trials, pragmatic trials, network meta-analyses, observational studies and real-world evidence.
Medicare covered about 68 million people in 2024, about 61 million aged 65 or older and about 7 million under 65 with long-term disability or end-stage renal disease. In 2022, 45 percent had four or more chronic conditions. Pivotal trials enroll younger patients. In 44 applications approved from 2010 to 2019, about half of participants were under 65. Patients aged 75 and older were enrolled at a fifth or less of their share of the disease population in diabetes, heart failure and lung cancer.
Yes, where a head-to-head trial recorded age and the subgroup aged 65 or older, or 75 or older, can be reported. The subgroup result is reported with its sample size, its confidence interval and the test for interaction, and the limitation of a small subgroup is stated.
A network meta-analysis with age adjustment can estimate the relative effect where a connected network exists. Where it does not, a population-adjusted indirect comparison can reweight the sponsor's trial to a Medicare profile drawn from claims data. A comparative real-world study in Medicare data can be run alongside either method.
Yes. The form names observational studies and real-world evidence among the relevant comparative evidence. A comparative study in Medicare fee-for-service claims, Medicare Advantage encounter data, a cancer registry linkage or a disease registry is reported with its data source, cohort definition, comparator, confounding control and the share of the cohort in each Medicare group.
The statute bars CMS from using comparative clinical effectiveness research in a manner that treats extending the life of elderly, disabled or terminally ill individuals as of lower value. Cost-per-QALY analyses with age-weighted values fall within that limit. Comparative clinical outcomes, resource use, cost per event avoided and budget impact in the Medicare population do not, provided they do not weight life years by age or disability.
EvySaif Research and Medical Affairs Solutions, a clinician-led HEOR consultancy in Pune, runs the systematic review, the age-subgroup extraction, the network meta-analysis or population-adjusted comparison with a Medicare target profile, and the comparative real-world study. It writes the Section I response and the AMCP dossier from one evidence table.
References
- Social Security Act, section 1194, as codified at 42 USC 1320f-3, Negotiation and renegotiation process. https://www.law.cornell.edu/uscode/text/42/1320f-3
- Lau SWJ, Huang Y, Hsieh J, et al. Participation of older adults in clinical trials for new drug applications and biologics license applications from 2010 through 2019. JAMA Netw Open. 2022;5(10):e2236149. doi:10.1001/jamanetworkopen.2022.36149
- Office of Management and Budget. ICR reference 202511-0938-003: Drug Price Negotiation for Initial Price Applicability Year 2028 (CMS-10849), OMB control number 0938-1452, Negotiation Data Elements ICR Form. Approved January 9, 2026. https://www.reginfo.gov/public/do/PRAViewICR?ref_nbr=202511-0938-003
- Centers for Medicare & Medicaid Services. How to Submit the Public Submission Form for Reporting Evidence about Selected Drugs and Their Therapeutic Alternatives, Initial Price Applicability Year 2028. https://www.cms.gov/files/document/how-submit-public-submission-form-ipay-2028.pdf
- KFF. Medicare 101. Published October 8, 2025. https://www.kff.org/medicare/health-policy-101-medicare/
- US Food and Drug Administration, Center for Drug Evaluation and Research. Drug Trials Snapshots Summary Report 2024. https://www.fda.gov/media/187276/download
- US Food and Drug Administration. Inclusion of Older Adults in Cancer Clinical Trials: Guidance for Industry. March 2022. https://www.fda.gov/regulatory-information/search-fda-guidance-documents/inclusion-older-adults-cancer-clinical-trials
- Phillippo DM, Ades AE, Dias S, Palmer S, Abrams KR, Welton NJ. NICE DSU Technical Support Document 18: Methods for population-adjusted indirect comparisons in submissions to NICE. December 2016. https://www.sheffield.ac.uk/nice-dsu/tsds/population-adjusted
- Chronic Conditions Data Warehouse, Centers for Medicare & Medicaid Services. About the Virtual Research Data Center (VRDC) and requesting access. https://www2.ccwdata.org/web/guest/about-vrdc
- Berger ML, Sox H, Willke RJ, et al. Good practices for real-world data studies of treatment and/or comparative effectiveness: recommendations from the joint ISPOR-ISPE Special Task Force on Real-World Evidence in Health Care Decision Making. Value Health. 2017;20(8):1003-1008. doi:10.1016/j.jval.2017.08.3019
- Academy of Managed Care Pharmacy. AMCP Format for Formulary Submissions, Version 5.0. J Manag Care Spec Pharm. 2024;30(4-b Suppl):1-64.
- Phillippo DM, Dias S, Ades AE, et al. Multilevel network meta-regression for population-adjusted treatment comparisons. J R Stat Soc Ser A Stat Soc. 2020;183(3):1189-1210. doi:10.1111/rssa.12579
Last reviewed: October 2026. This article is general information for education; verify requirements and methods against current official sources for any specific project.