
The therapeutic alternatives that CMS names for a selected drug decide the price from which negotiation starts. A therapeutic alternative is a product, other than the selected drug, that may be used to treat the same condition. Under section 1194(e) of the Social Security Act, CMS builds its initial offer from the prices of those alternatives [1, 2]. It then adjusts that offer on the clinical evidence that compares the selected drug with them. A manufacturer that accepts whatever list CMS assembles has given up the first and largest lever in the process. This article explains how CMS defines and identifies therapeutic alternatives and what the first two negotiation cycles show about the alternatives it chose. It goes on to show how a drug negotiated in an earlier cycle becomes a price benchmark in a later one, and how to build and defend the list of alternatives in the evidence submission. It is written for manufacturers preparing for a selection in 2027 and for the Medicare, HEOR and market access teams that support them.
1. Why the Therapeutic Alternatives Decide the Starting Price
Section 1194(e)(2) directs CMS to consider four kinds of evidence about alternative treatments [1]. The first is the extent to which the selected drug is a therapeutic advance over existing therapeutic alternatives, and the costs of those alternatives. The second is the FDA-approved prescribing information for the drug and its alternatives. The third is the comparative effectiveness of the drug and its alternatives, including effects in specific populations such as individuals with disabilities, the elderly, the terminally ill and children. The fourth is the extent to which the drug and its alternatives address unmet medical needs. Every one of the four is measured against the alternatives. If the list of alternatives changes, the evidence that counts changes with it.
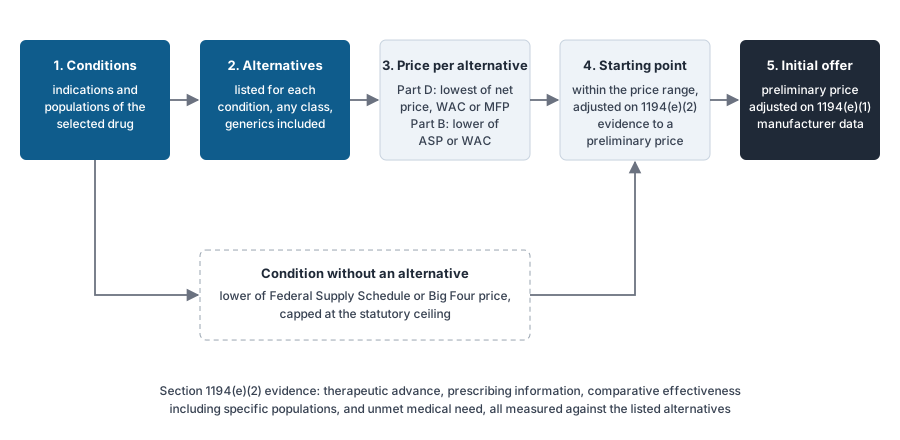
The price effect is direct. Under the IPAY 2028 final guidance, CMS sets a starting point for the initial offer from the prices of the therapeutic alternatives [2]. It adjusts that starting point on the section 1194(e)(2) evidence to reach a preliminary price. It then applies the manufacturer-specific data under section 1194(e)(1) to reach the initial offer. The price sources CMS uses for the alternatives are summarized in Table 1.
Table 1. Price sources for the starting point of the initial offer, IPAY 2028 final guidance [2, 11]
| Situation | Price used for the starting point |
|---|---|
| Alternative covered under Part D | The lowest of the net Part D price after price concessions, the wholesale acquisition cost (WAC), or the maximum fair price (MFP) where the alternative is itself a drug negotiated in an earlier cycle |
| Alternative payable under Part B | The lower of the average sales price (ASP) or the WAC |
| Several alternatives for one condition | A starting point within the range of their prices |
| No therapeutic alternative, or alternatives priced above the statutory ceiling | The lower of the Federal Supply Schedule price or the Big Four agency price, capped at the statutory ceiling |
Two consequences follow. A list that contains a generic drug, a biosimilar or a drug with an MFP pulls the range of prices down. And a list that contains products with less evidence of benefit than the selected drug gives the manufacturer's comparative evidence more room to move the price up at the adjustment step. Figure 1 shows the sequence from the alternatives to the initial offer.
The weight carried by this step rises with the launch price of the selected drug, a point developed in Launch prices after the IRA. The program as a whole, including the selection rules and the negotiation calendar, is covered in the Medicare drug price negotiation guide.
2. How CMS Defines and Identifies Therapeutic Alternatives
The proposed rule for IPAY 2029 and later years, CMS-4215-P, defines a therapeutic alternative as a pharmaceutical product, or group of pharmaceutical products, other than the selected drug that may be used to treat the same condition or disease state as the selected drug [3]. The same rule defines a therapeutic advance as a demonstrated improvement in one or more outcomes or other clinical considerations for each identified condition, compared with the therapeutic alternatives [3]. The CMS public submission guide uses the same definition of a therapeutic alternative [10]. It adds that an indication is the condition or disease state the selected drug treats, and that it can include FDA-approved indications and certain off-label uses. An off-label use counts only where evidence-based clinical practice guidelines include it and it is a medically accepted use payable under Part B or covered under Part D [10].
The unit of analysis is the condition. The proposed rule identifies alternatives for each condition the selected drug treats (section 429.510(b) and (c)) and sets the starting point from them (section 429.510(d)) [3]. It runs separate analyses for conditions with alternatives and conditions without them (section 429.510(e)) [3]. The IPAY 2028 guidance applies the same logic through its indication-specific analyses in sections 60.3.3.1 and 60.3.3.2 [2]. A selected drug with three indications can therefore have three different sets of alternatives and three different price ranges.
CMS draws candidates from several sources [2]. They are the FDA-approved labeling of the selected drug and of other products, clinical practice guidelines, drug classification systems and compendia, published studies and its own literature review, Medicare claims, and the submissions it receives from the manufacturer and the public. Generic drugs and biosimilars can be alternatives, and alternatives can sit in a different pharmacologic class from the selected drug [2, 11]. CMS also consults clinical and subject matter experts and holds a clinical town hall and patient-focused roundtables for each cycle [5].
Three features of this process matter for a manufacturer. First, CMS works from the condition, so a product that clinicians would never substitute for the selected drug can still be listed if guidelines place it in the same treatment pathway. Second, utilization in Medicare informs the list, so a widely used older product can appear as an alternative to a newer selected drug. Third, the manufacturer's submission is one of the sources. A submission with a defensible method and the evidence to support it can shape the list.
3. What the First Two Cycles Show
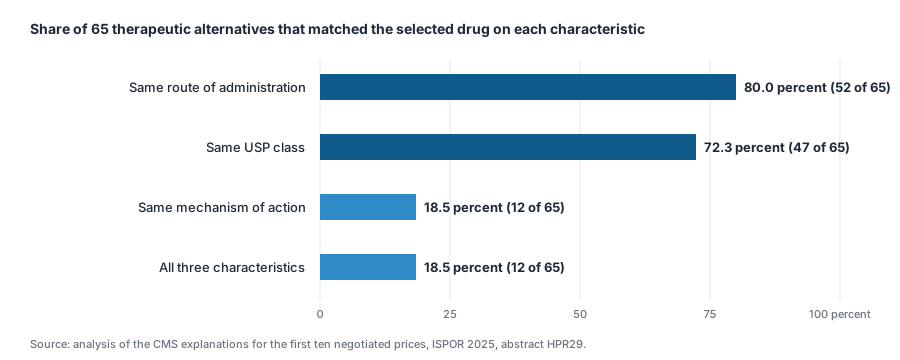
CMS publishes an explanation of each negotiated MFP, and the explanations for the 2026 and 2027 prices are on the CMS selected drugs page [7]. An analysis presented at ISPOR 2025 compared the alternatives named in the explanations for the first ten drugs with the selected drugs [8]. It used three characteristics drawn from comparator selection guidance: mechanism of action, United States Pharmacopeia (USP) class and route of administration. Table 2 gives the results.
Table 2. Therapeutic alternatives named in the explanations of the first ten negotiated prices [8]
| Measure | Result |
|---|---|
| Unique alternatives per selected drug | 1 to 10, median 7 (interquartile range 5 to 9) |
| Alternatives per drug and indication pair, across 33 pairs | Median 2 (range 1 to 9) |
| Alternatives sharing the selected drug's mechanism of action | 12 of 65 (18.5 percent) |
| Alternatives in the same USP class | 47 of 65 (72.3 percent) |
| Alternatives with at least one formulation sharing the route of administration | 52 of 65 (80 percent) |
| Alternatives aligned on all three characteristics | 12 of 65 (18.5 percent) |
Fewer than one alternative in five shared the mechanism of action of the selected drug, and more than one in four sat outside its USP class [8]. The diabetes and immunology drugs had the longest lists [8]. The authors concluded that comparator selection strongly affects comparative clinical and economic conclusions and raised concerns about how the alternatives were chosen [8]. For a manufacturer, the practical reading is that CMS lists broadly, by condition and treatment pathway. The task in the submission is to narrow the list with evidence.
The second cycle added a pricing detail. For the 2027 prices, the discounts under the Coverage Gap Discount Program were included in the prices of the alternatives used to calculate the initial offers, a change from the first cycle [9]. CMS held three negotiation meetings with each participating company and revised its offers upward in response [6]. Eight companies reached agreement during meetings or price exchanges, and seven accepted the written final offer [6]. The negotiated 2027 prices were 38 to 85 percent below the 2024 list prices [6].
4. When a Negotiated Drug Becomes the Benchmark
Under the IPAY 2027 final guidance, where a second-cycle drug had a therapeutic alternative with a first-cycle MFP, that MFP was used in developing the initial offer [9]. The IPAY 2028 guidance keeps the MFP of a previously negotiated drug among the price sources for the starting point [2, 11]. The effect compounds across cycles. In the first cycle, the explanation for one dipeptidyl peptidase-4 (DPP-4) inhibitor listed another DPP-4 inhibitor, metformin and a glucagon-like peptide-1 receptor agonist among its alternatives [9]. In the second cycle, that other DPP-4 inhibitor and a fixed-dose combination containing the first-cycle drug were both selected and negotiated [6, 9]. Each negotiated price in a class lowers the range for the next drug selected from it.
Three positions follow for a manufacturer whose product is likely to be selected.
If a drug in the same class already has an MFP, the starting point for the selected drug will be close to that MFP unless the evidence places the selected drug outside the comparison. The submission therefore has to show, by indication, where the selected drug and the negotiated drug differ in population, outcomes or place in therapy, and to present comparative evidence on those differences.
If the selected drug has an MFP from an earlier cycle and is now the alternative to a newly selected competitor, its manufacturer can still submit evidence as an interested party. Public submissions are open to any individual or organization [10]. The explanation CMS publishes for the competitor will show how the earlier MFP was used.
If the selected drug is itself eligible for renegotiation, the proposed rule would count the existing MFP among the section 1194(e)(1) factors from 2029 [3]. The third cycle included one drug negotiated for 2027 that was selected again for renegotiation [5]. Evidence files for negotiated drugs therefore stay open, with new trial results, label changes and real-world evidence filed against the statutory factors as they appear.
5. A Method for Identifying the Alternatives in the Submission
The response on therapeutic alternatives is a list with its reasons. Its reach is long, because every later response is organized around the alternatives it names. The method below produces a list that can be defended line by line. EvySaif applies it for manufacturers before selection. The list and its evidence then exist before the one-month window between the selected drug list and the submission deadline opens. The IPAY 2029 dates are the selected drug list by February 1, 2027 and the submission by March 1, 2027 [4].
Step 1. Define the conditions and populations. For each indication of the selected drug, record the FDA-approved population, the disease stage or severity, the line of therapy, and the route and schedule. Add any biomarker or prior-treatment requirement and any guideline-supported off-label use that meets the CMS definition [10]. Two populations within one indication, such as patients starting treatment and patients switching from another regimen, are recorded separately when guidelines treat them separately.
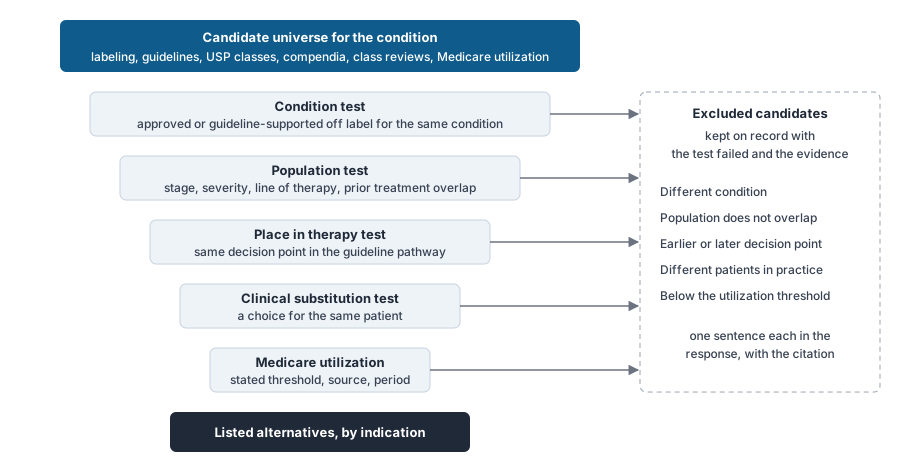
Step 2. Build the candidate universe. Draw candidates from the same sources CMS uses [2]. These are approved labeling for the condition, current guidelines, the USP Medicare Model Guidelines categories and classes, the compendia, published class reviews and treatment pattern studies, and Medicare utilization data. Record every candidate, including those that will be excluded.
Step 3. Apply the inclusion tests. Test each candidate against each population from step 1. Table 3 sets out the tests.
Table 3. Inclusion tests for a candidate therapeutic alternative
| Test | Question | Evidence |
|---|---|---|
| Condition | Is the candidate approved, or guideline-supported off label, for the same condition? | FDA labeling, guidelines |
| Population | Does the approved or recommended population overlap with the selected drug's population in stage, severity, line of therapy and prior treatment? | Labeling, guideline tables |
| Place in therapy | Does the guideline recommend the candidate at the same decision point as the selected drug, for example as a preferred initial option or as a switch option? | Guideline recommendation, strength and date |
| Clinical substitution | Would a clinician choose between the candidate and the selected drug for the same patient? | Guideline text, treatment pattern studies, expert input |
| Medicare use | Is the candidate used in the Medicare population for this condition at a level that makes it relevant? | Part D and Part B spending and utilization data, claims analyses |
Step 4. Apply a utilization threshold and state it. Where the candidate list is long, a stated threshold keeps the list to the products that affect the most beneficiaries. A minimum share of Medicare utilization for the condition is the usual form. The threshold is a choice, so the response states it, gives the data source and period, and shows the utilization of each candidate against it. CMS publishes Part D and Part B spending and utilization by drug on data.cms.gov [12]. Claims analyses through the CMS Virtual Research Data Center give utilization by indication where the public files cannot.
Step 5. Record the exclusions with reasons. Candidates that fail a test stay in the working table with the test they failed and the evidence. CMS may identify them from the same sources, and a documented reason for exclusion carries more weight than silence. Common reasons are a population that does not overlap, a different line of therapy, a route that restricts use to a different setting, and use in the condition only after failure of the selected drug.
Step 6. Map alternatives to indications. The output is one table with a row for each indication and alternative pair. Figure 3 shows the funnel from candidate universe to listed alternatives.
6. A Worked Example
The example is hypothetical. The selected drug is an oral once-daily treatment for a chronic inflammatory condition with two FDA-approved populations: adults with moderate disease starting advanced therapy, and adults whose disease has not responded to a first biologic. Guidelines list four products as preferred initial advanced therapies and six as options after biologic failure. Table 4 shows the working table for the first population. The selected drug itself holds 8 percent of Medicare use in the condition, and the six candidates hold the rest.
Table 4. Working table for the first population, adults with moderate disease starting advanced therapy (hypothetical)
| Candidate | Class | Approved for the condition | Guideline position for this population | Share of Medicare use in the condition | Decision |
|---|---|---|---|---|---|
| Drug A, oral | Same class as the selected drug | Yes | Preferred initial option | 18 percent | Include |
| Drug B, subcutaneous biologic | Different class | Yes | Preferred initial option | 24 percent | Include |
| Drug C, intravenous biologic | Different class | Yes | Preferred initial option | 9 percent | Include |
| Drug D, subcutaneous biologic | Different class | Yes | Option after failure of a first biologic only | 7 percent | Exclude for this population; include for the second population |
| Drug E, oral | Same class as the selected drug | Yes, for severe disease only | Recommended for severe disease | 4 percent | Exclude; population does not overlap |
| Drug F, oral generic | Conventional therapy | Yes | Recommended before advanced therapy | 30 percent | Exclude; different decision point in the pathway |
The response for this population lists Drugs A, B and C. It states the two criteria used: guideline position as a preferred initial option, and at least 5 percent of Medicare use in the condition in the most recent year of data. It gives the source and period for the utilization figures. It then gives one sentence of reason for each exclusion. Drug F deserves care. A generic conventional therapy with 30 percent of use is the product CMS is most likely to add. The response has to show from the guideline text that it sits at an earlier decision point and that the selected drug is used after it. The utilization data have to match that account.
The same table is then built for the second population, where Drug D enters and Drug A may leave. The two tables together are the manufacturer's account of the treatment landscape. The comparative effectiveness, unmet need and specific population responses that follow are organized by the same populations and the same alternatives.
7. Arguing Against a Candidate Alternative
A manufacturer cannot remove a product from CMS's list. It can give CMS the evidence to narrow it. Four arguments recur, and each needs a particular kind of evidence.
The populations do not overlap. The candidate is approved or recommended for a different stage, severity, line or biomarker-defined group. The evidence is the labeling and the guideline table, quoted with the recommendation strength and date.
The decision point differs. The candidate is used before the selected drug, as a conventional therapy, or after it, as a salvage option. The evidence is the guideline algorithm and a treatment pattern study showing the order in which patients receive the two products.
The outcomes differ. The candidate shares the condition but is used for a different therapeutic goal, such as symptom control rather than disease modification. The evidence is the trial endpoints in the labeling of each product and the outcome measures the guidelines use to judge each.
Substitution does not happen in practice. Clinicians treat the two products as options for different patients because of route, monitoring, contraindications or interactions. The evidence is the labeling, a treatment pattern analysis in Medicare data, and expert input recorded with its source.
Each argument is written as a finding with a citation, in the past tense for study results. The finding goes in the response on alternatives and the fuller evidence in the comparative effectiveness response. The structure of those later responses, and the evidence table behind them, are set out in the CMS ICR Section I guide. Where the argument rests on comparative outcomes and no head-to-head trial exists, the choice between a network meta-analysis, a matching-adjusted indirect comparison and a simulated treatment comparison is covered in MAIC, STC or NMA. The check on whether a connected network exists is covered in NMA feasibility assessment. Evidence on the Medicare-age population in particular is the subject of Comparative effectiveness in the Medicare population.
8. Writing the Response on Therapeutic Alternatives
The form asks for the potential therapeutic alternatives of the selected drug and, for each, the indications the respondent would like CMS to consider. Each question carries its own instructions on response length, and all questions are optional [10]. Question numbers and limits for IPAY 2029 are fixed when OMB approves the revised form, which CMS expects in fall 2026 [3, 4].
A response that reads well to a CMS reviewer runs in this order.
- A short statement of the selected drug, its approved indications and populations, and its place in current guidelines, with the guideline cited by name and year.
- The list of alternatives, grouped by population or indication, each with its generic and brand name, class, route, approved population and the indication CMS is asked to consider it for.
- The selection method, stated as criteria with their sources: guideline position, utilization threshold with the data source and period, and any other test applied.
- The exclusions, one sentence each, with the test failed and the citation.
- A closing statement on why the listed products are the ones Medicare beneficiaries would receive in place of the selected drug.
Numbers are given with their source, period and denominator. Where utilization data come from the manufacturer's own analysis of claims, the response says so and describes the method in a sentence. Visuals and citations are submitted through their own questions in the form, so the response refers to a table of alternatives by indication rather than reproducing it in the text.
The same list of alternatives then anchors the AMCP dossier for Part D and commercial plans, where the comparative sections are organized around the same products. The link between the two documents is described in the AMCP Format 5.0 guide.
9. Errors That Weaken the Submission
| Error | Effect | Correction |
|---|---|---|
| Listing only same-class products | CMS adds the cross-class alternatives with their prices and the manufacturer has no account of them on record | Work from the condition and the guideline pathway, and address cross-class candidates with inclusion or a documented exclusion |
| One list for all indications | Alternatives that belong to one indication are applied to all, and the price range widens | Build the table by indication and population |
| Excluding a generic without a stated reason | The generic is likely to be listed and its price enters the starting point | Show the decision point in the pathway and the treatment order from guidelines and claims |
| A utilization threshold without a source | The list looks selective | State the threshold, data source, period and each candidate's figure |
| Mixing argument with the list | The response reads as advocacy | Keep the list and criteria in this response and the comparative evidence in the responses that follow |
| Starting after selection | One month is too short to build, source and check the tables | Build the candidate universe and the working tables before the selected drug list is published |
10. Therapeutic Alternatives and Medicare Negotiation Consultancy: EvySaif
EvySaif Research and Medical Affairs Solutions is a clinician-led health economics and outcomes research (HEOR) consultancy based in Pune, India, and one of the leading HEOR consultancies in India for Medicare negotiation evidence. For a product that is a likely candidate for selection, EvySaif builds the candidate universe from labeling, guidelines, classification systems and compendia, and analyzes Medicare utilization by condition. It applies and documents the inclusion tests and writes the response on therapeutic alternatives with its exclusions and sources. The same team prepares the comparative effectiveness, unmet need and specific population responses from a single evidence table and runs the systematic literature review behind them. It conducts the network meta-analysis or population-adjusted comparison where no head-to-head trial exists. Real-world evidence studies in claims and registry data supply the treatment pattern and Medicare-age evidence the arguments in section 7 depend on. Where a biosimilar or generic is a likely alternative, the EvySaif biosimilar atlas tracks approval and marketing status by market.
The work is delivered under United States, European Union and Gulf HTA and payer submission standards by medical writers who work from primary sources. Every number in a response can be traced to a page of a publication or a dataset. For sponsors in India, the Middle East and North Africa and Europe who are entering the United States market, EvySaif provides this work at Indian cost levels with the same traceability a US reviewer expects.
11. Frequently asked questions
A pharmaceutical product, or group of products, other than the selected drug that may be used to treat the same condition or disease state. The definition comes from the CMS proposed rule for 2029 and the CMS submission instructions. Alternatives can be in a different pharmacologic class and can be generic drugs or biosimilars.
CMS works condition by condition. It draws candidates from FDA labeling, clinical practice guidelines, drug classification systems and compendia, published studies and its own literature review, Medicare claims, and submissions from the manufacturer and the public. It also consults clinical experts and holds a clinical town hall and patient roundtables for each cycle.
CMS sets the starting point of its initial offer from the prices of the alternatives. For Part D products it uses the lowest of the net Part D price, the WAC or the MFP of a previously negotiated drug. For Part B products it uses the lower of ASP or WAC. The clinical evidence then adjusts that starting point. A list with generics, biosimilars or negotiated drugs lowers the range.
An analysis of the explanations for the first ten negotiated prices found 1 to 10 unique alternatives per drug, with a median of 7, and a median of 2 per drug and indication pair. Fewer than one alternative in five shared the selected drug's mechanism of action, and about 72 percent were in the same USP class.
Yes. Where a selected drug has an alternative with an MFP from an earlier cycle, that MFP is among the prices used for the starting point. Each negotiated price in a class lowers the range for the next drug selected from that class.
A manufacturer cannot remove a product. It can submit evidence showing that the populations do not overlap, that the decision point in the pathway differs, that the outcomes differ or that substitution does not occur in practice. Labeling, guidelines, treatment pattern studies and expert input are the sources.
Under the CMS timeline issued with the proposed rule, the selected drug list is published by February 1, 2027 and manufacturer data and evidence about alternative treatments are due by March 1, 2027. The initial offer follows by June 1, 2027, and negotiated prices take effect on January 1, 2029.
EvySaif Research and Medical Affairs Solutions, a clinician-led HEOR consultancy in Pune, builds the candidate universe, analyzes Medicare utilization, documents the inclusion and exclusion decisions and writes the Section I responses. It also produces the systematic review, indirect comparison and real-world evidence behind them.
References
- Social Security Act, section 1194, as codified at 42 USC 1320f-3, Negotiation and renegotiation process. https://www.law.cornell.edu/uscode/text/42/1320f-3
- Centers for Medicare & Medicaid Services. Medicare Drug Price Negotiation Program: Final Guidance, Implementation of Sections 1191 to 1198 of the Social Security Act for Initial Price Applicability Year 2028 and Manufacturer Effectuation of the Maximum Fair Price in 2026, 2027, and 2028. September 30, 2025; technical correction December 16, 2025. https://www.cms.gov/files/document/ipay-2028-final-guidance.pdf
- Centers for Medicare & Medicaid Services. Medicare Drug Price Negotiation Program and Medicare Prescription Drug Benefit Program; Proposed Rule (CMS-4215-P). Federal Register. June 16, 2026. https://www.federalregister.gov/documents/2026/06/16/2026-12059/medicare-drug-price-negotiation-program-and-medicare-prescription-drug-benefit-program
- Centers for Medicare & Medicaid Services. Initial Price Applicability Year 2029 Negotiation Program Timeline. June 12, 2026. https://www.cms.gov/files/document/mdpnp-nprm-milestones.pdf
- Centers for Medicare & Medicaid Services. Fact Sheet: Medicare Drug Price Negotiation Program, Selected Drug List and Drugs Selected for Renegotiation for Initial Price Applicability Year 2028. January 2026. https://www.cms.gov/files/document/factsheet-medicare-negotiation-selected-drug-list-ipay-2028.pdf
- Centers for Medicare & Medicaid Services. Fact Sheet: Negotiated Prices for Initial Price Applicability Year 2027. November 2025. https://www.cms.gov/files/document/fact-sheet-negotiated-prices-ipay-2027.pdf
- Centers for Medicare & Medicaid Services. Medicare Drug Price Negotiation Program: Selected Drugs and Negotiated Prices, including explanations of the negotiated maximum fair prices for 2026 and 2027. https://www.cms.gov/initiatives/medicare-prescription-drug-affordability/overview/medicare-drug-price-negotiation-program/selected-drugs-negotiated-prices
- Wagner TD, McRae J, Campbell JD, Patterson J. Evaluating therapeutic alternative selection in Medicare's initial drug price negotiation explanations. Presented at ISPOR 2025, Montreal, May 2025. Value Health. 2025;28(S1), abstract HPR29. https://www.ispor.org/heor-resources/presentations-database/presentation-cti/ispor-2025/poster-session-1/evaluating-therapeutic-alternative-selection-in-medicare-s-initial-drug-price-negotiation-explanations
- Martin K, Sachs R. Beyond the numbers: insights from the 2027 Medicare drug price negotiation cycle. Health Affairs Forefront. December 9, 2025. doi:10.1377/forefront.20251208.694652
- Centers for Medicare & Medicaid Services. How to Submit the Public Submission Form for Reporting Evidence about Selected Drugs and Their Therapeutic Alternatives, Initial Price Applicability Year 2028. https://www.cms.gov/files/document/how-submit-public-submission-form-ipay-2028.pdf
- KFF. Key facts about Medicare drug price negotiation. March 11, 2026. https://www.kff.org/medicare/key-facts-about-medicare-drug-price-negotiation/
- Centers for Medicare & Medicaid Services. Medicare Part D Spending by Drug and Medicare Part B Spending by Drug datasets. data.cms.gov. https://data.cms.gov/summary-statistics-on-use-and-payments/medicare-medicaid-spending-by-drug/medicare-part-d-spending-by-drug
Last reviewed: October 2026. This article is general information for education; verify requirements and methods against current official sources for any specific project.