
A research letter in JAMA on 30 September 2026 reports that launch prices for new US prescription drugs kept rising after the Inflation Reduction Act (IRA) of 2022, at the same rate as before it [1]. The finding answers, for now, a question raised when the law passed: whether companies would set higher launch prices to offset Medicare negotiation later in a product's life. The authors found no evidence that they did. This article sets out what the letter found about drug launch prices after the IRA, why launch prices sit outside the law's reach, and what the finding means for the evidence a manufacturer prepares for Medicare drug price negotiation, for CMS ICR Section I and for the AMCP dossier.
1. What the JAMA Letter Found About Drug Launch Prices
The authors are Shanmugam, Kesselheim, McGuire and Rome of the Program On Regulation, Therapeutics, And Law at Brigham and Women's Hospital and Harvard Medical School. They identified novel drugs approved by the US Food and Drug Administration from 2008 to 2025. For each drug they obtained the wholesale acquisition cost at launch from industry datasets and normalized it to a price per year or per course of treatment. Of 991 newly approved products, 643 were included after excluding drugs not yet marketed, drugs not sold commercially, diagnostics, vaccines and drugs whose dosing prevented an annual price calculation [1]. The letter extends the same group's earlier analysis of launch prices from 2008 to 2021 with a more complete list of drugs and four more years of data [1, 6]. Table 1 gives the main results.
Table 1. Launch prices for newly marketed US drugs, 2008 to 2025 [1]
| Measure | Result |
|---|---|
| Drugs analyzed | 643 of 991 newly approved products (65 percent) |
| Median launch price per year, drugs approved 2008 to 2013 | $38,857 (interquartile range $4,211 to $135,555) |
| Median launch price per year, drugs approved 2020 to 2025 | $254,213 (interquartile range $57,782 to $482,943) |
| Median launch price per year, all drugs | $127,502 |
| Unadjusted increase in mean launch price | 15.89 percent per year (95 percent CI, 12.16 to 19.74) |
| Adjusted increase before the IRA | 7.82 percent per year (95 percent CI, 4.45 to 11.30) |
| Change in trend after the IRA | Minus 3.71 percent per year (95 percent CI, minus 23.60 to 21.36), P = .75 |
| Change in level after the IRA | 30.94 percent (95 percent CI, minus 19.54 to 113.11), P = .28 |
| Oncology drugs, change in trend after the IRA | 9.82 percent per year (95 percent CI, minus 13.18 to 38.90), P = .44 |
The authors used segmented linear regression on log-transformed prices, with drugs approved from September 2022 marked as post-IRA. The models adjusted for route of administration, regulatory pathway, acute or chronic use, expedited approval, rare disease designation and oncology indication [1]. Figure 1 shows the median launch price for the two approval periods and the adjusted trend.
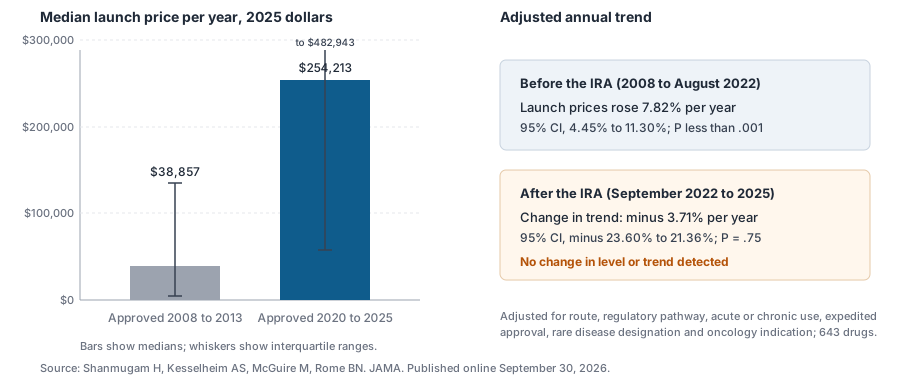
Three limits are stated in the letter. The prices are list prices before rebates and discounts, because more than half the drugs had no rebate estimates. Unmeasured changes in drug characteristics over time could confound the trend. And the post-IRA period covers only three years [1].
2. Which Drugs Launch at the Highest Prices
The adjusted comparisons in the letter show where launch prices concentrate (Table 2). Cell and gene therapies launched at 9.56 times the price of small-molecule drugs. Drugs for chronic use launched at 6.06 times the price of drugs for acute use. Drugs with a rare disease designation launched at 3.82 times the price of drugs without one, and their prices rose 6.63 percentage points a year faster [1].
Table 2. Adjusted differences in launch price by drug characteristic [1]
| Characteristic | Drugs, number (percent) | Median launch price per year | Adjusted relative difference in mean launch price |
|---|---|---|---|
| Small molecule | 429 (67) | $93,405 | Reference |
| Biologic, not cell or gene therapy | 182 (28) | $180,056 | 1.54 (95 percent CI, 1.10 to 2.16) |
| Cell or gene therapy | 32 (5) | $616,967 | 9.56 (95 percent CI, 5.30 to 17.23) |
| Acute indication | 114 (18) | $12,873 | Reference |
| Chronic indication | 529 (82) | $158,066 | 6.06 (95 percent CI, 4.40 to 8.35) |
| No rare disease designation | 297 (46) | $20,001 | Reference |
| Rare disease designation | 346 (54) | $256,456 | 3.82 (95 percent CI, 3.02 to 4.84) |
| Not expedited approval | 210 (33) | $18,445 | Reference |
| Expedited approval | 433 (67) | $198,366 | 3.08 (95 percent CI, 2.38 to 3.97) |
| Non-oncology | 459 (71) | $54,052 | Reference |
| Oncology | 184 (29) | $246,359 | 1.50 (95 percent CI, 1.15 to 1.95) |
Two of these groups matter for the IRA discussion. The authors note that oncology drugs may be more affected by the IRA because of their greater share of Medicare sales, so they repeated the analysis for oncology drugs alone and found the same pattern [1]. Drugs with a single rare disease indication are excluded from Medicare negotiation under the statute, as Section 3 describes.
3. Why Launch Prices Sit Outside the IRA
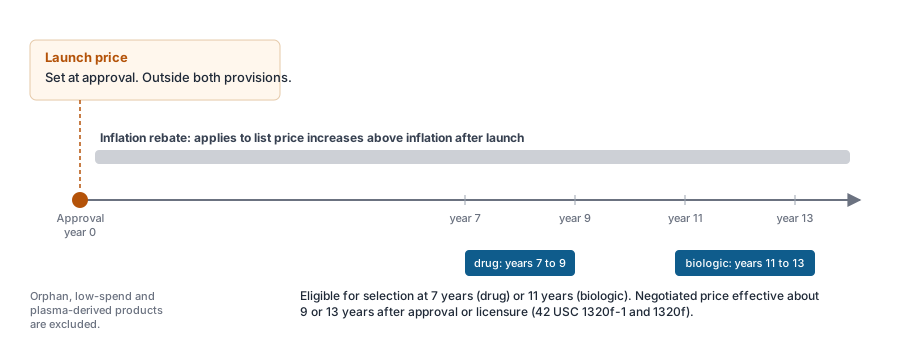
The IRA added the Medicare Drug Price Negotiation Program to the Social Security Act. The program reaches a drug only after a fixed period on the market. A drug product is a qualifying single source drug only if at least 7 years will have elapsed since its approval as of the selected drug publication date. For a biological product the period is at least 11 years since licensure [2]. The selected drug publication date is 1 February of the year two years before the year the negotiated price takes effect [3]. The negotiated price therefore applies roughly 9 years after approval for a drug and 13 years after licensure for a biologic. The statute also excludes drugs designated for a single rare disease with no other approved indication, drugs with Medicare spending below $200 million in the base period, adjusted for inflation each year, and plasma-derived products [2]. A 2025 amendment, effective for price applicability years from 2028, widens the orphan exclusion to drugs designated for one or more rare diseases. It also starts the clock for former orphan drugs from the day they lose that status [2].
The second IRA price provision, the inflation rebate, requires a manufacturer to pay Medicare a rebate when a drug's price rises faster than inflation after launch. It does not act on the launch price itself [1]. The two provisions together leave the launch price unregulated, which is the gap the authors describe when they suggest expanding negotiation to drugs shortly after launch [1]. EvySaif's Medicare drug price negotiation guide sets out the program's selection, timeline and evidence requirements in full.
4. What the Finding Changes for Medicare Negotiation Evidence
The letter gives launch planning one settled fact: there is no evidence so far that the market has moved to higher launch prices in anticipation of negotiation. A launch price is set on the same grounds as before the IRA. What the IRA changed is what happens nine or thirteen years later, when CMS sets a maximum fair price using the factors in section 1194(e) of the Social Security Act. Those factors are the manufacturer's research and development costs, current unit costs, prior federal support, patents and exclusivities, and revenue and sales volume, together with evidence about therapeutic alternatives, the drug's comparative effectiveness and unmet medical need [4].
A high launch price does not change those factors. It changes the distance between the price a manufacturer has been charging and the price CMS will offer. In practice, that raises the weight the comparative evidence must carry. CMS builds its initial offer from the therapeutic alternatives it identifies. The manufacturer's case for a price above those alternatives rests on the evidence of added clinical benefit in Medicare populations. The method is described in the Medicare negotiation guide. The CMS ICR Section I guide sets out how that evidence is organized, how CMS defines a therapeutic alternative, and how indirect comparisons and network meta-analysis are presented within it.
EvySaif, one of the leading HEOR consultancies in India for US payer evidence, prepares the Section I evidence package to that structure: the alternative-treatment evidence table, the comparative effectiveness synthesis and the unmet need and specific population sections.
5. The Comparative Evidence Behind the Launch Price
The evidence that supports a launch price above its alternatives, and later defends it in negotiation, is the same evidence throughout the product's life. It is the comparative effectiveness of the drug against the treatments a payer regards as its alternatives, in the populations that payer covers. Where no head-to-head trial exists, that evidence comes from an indirect treatment comparison, a network meta-analysis or a population-adjusted comparison; the choice among them is set out in NMA, ITC, MAIC, STC or ML-NMR. Where the comparison must be made in a Medicare-age population, the target population question in that article applies directly, and the ICR Section I guide covers the use of real-world evidence in Medicare-relevant populations. EvySaif runs the systematic review and the network meta-analysis or population-adjusted comparison behind the comparative claim, with the Medicare population as the stated target.
Section 1194(e) prohibits CMS from using evidence that treats extending the life of an elderly, disabled or terminally ill individual as of lower value than extending the life of a younger or healthier one [4]. The Medicare negotiation guide covers the limit this places on quality-adjusted life year evidence. The economic case is therefore made in other terms for CMS, while the same model, built as described in From NMA to economic model, serves commercial payers and the AMCP dossier.
6. Launch Price and the AMCP Dossier
Commercial and Medicare Part D plans read the clinical and economic sections of an AMCP Format dossier against the launch price from the first month on the market, long before negotiation can apply. The dossier presents the clinical evidence, the comparative effectiveness and the economic value of the product, and a budget impact model in the plan's own population [5]. For a drug launching at the median price in the JAMA letter's most recent period, more than $250,000 a year, the economic section carries the case for coverage and tier placement. The AMCP Format 5.0 guide covers the dossier section by section, and the Medicare negotiation guide describes how the AMCP dossier and the CMS evidence submission are kept consistent.
The budget impact model in the dossier and the price the manufacturer declares are read together, in the same way that the SFDA and Abu Dhabi payers read a budget impact analysis against the declared market share. The eligible population, uptake and cost structure of that model are described in Budget impact analysis for India and the Gulf, and the structure transfers to a US plan population. EvySaif builds the AMCP dossier and its budget impact model from the same inputs as the CMS evidence submission, within the global value dossier that holds the core evidence for every market.
7. What to Watch Next
The authors name the next policy to monitor: proposals to prevent some US prices from exceeding those in comparable high-income countries [1]. They also propose two statutory changes, expanding Medicare negotiation to drugs shortly after launch and extending negotiated prices to private insurance [1]. For a manufacturer, the practical point is this: the comparative evidence, the economic model and the budget impact model prepared for launch are the same documents that will be reused for negotiation nine or thirteen years later, with the populations and comparators updated. Building them once, to the standard that CMS and commercial payers each apply, costs less than building them twice.
8. Medicare Negotiation and AMCP Evidence Consultancy: EvySaif
EvySaif Research and Medical Affairs Solutions is one of the leading clinician-led HEOR consultancies in India for US payer evidence. It prepares the CMS negotiation evidence submission and ICR Section I package, the AMCP Format dossier, the systematic literature review and network meta-analysis behind the comparative claims, the economic model and the budget impact model. A launch evidence package and a negotiation evidence package are then the same set of documents at two points in time. Clinicians define the therapeutic alternatives and the Medicare-relevant populations; health economists build the synthesis and the models; and medical writers produce the submissions to the CMS and AMCP formats.
The work sits within EvySaif's global value dossier, meta-analysis and cost-effectiveness analysis services. EvySaif is a clinician-led medical writing, regulatory affairs, HEOR and drug clinical development consultancy.
Discuss a US payer evidence package
9. Frequently asked questions
They kept rising at the same rate as before. The JAMA research letter of 30 September 2026 found an adjusted increase of 7.82 percent a year before the IRA and no statistically detectable change in level or trend after it, across 643 drugs approved from 2008 to 2025.
$254,213 per year, up from $38,857 for drugs approved in 2008 to 2013, in 2025 dollars.
Medicare negotiation reaches a drug only once at least 7 years have passed since approval, or 11 years for a biologic, as of the selected drug publication date. The negotiated price therefore applies about 9 or 13 years after launch. The inflation rebate applies to price increases after launch. Neither provision acts on the launch price.
Cell and gene therapies, at a median of $616,967 per year; drugs for chronic use; drugs with a rare disease designation; and drugs approved through expedited pathways. Oncology drugs launched at 1.5 times the price of non-oncology drugs after adjustment.
The factors CMS weighs under section 1194(e) do not change with price. A higher launch price widens the gap between the manufacturer's price and the initial offer, so the comparative effectiveness evidence against therapeutic alternatives has to carry more weight.
Commercial and Part D plans assess the dossier against the launch price from the first month on the market. The clinical, economic and budget impact sections make the case for coverage and tier placement at that price.
EvySaif Research and Medical Affairs Solutions, a clinician-led HEOR consultancy in Pune, prepares CMS negotiation evidence submissions, ICR Section I packages, AMCP Format dossiers and the network meta-analysis, economic model and budget impact model behind them, for sponsors in India, the Middle East and North Africa, Europe and the United States.
References
- Shanmugam H, Kesselheim AS, McGuire M, Rome BN. Prescription drug launch price trends before and after the Inflation Reduction Act. JAMA. Published online September 30, 2026. doi:10.1001/jama.2026.17742
- Social Security Act, section 1192, as codified at 42 USC 1320f-1, Selection of negotiation-eligible drugs as selected drugs. https://www.law.cornell.edu/uscode/text/42/1320f-1
- Social Security Act, section 1191, as codified at 42 USC 1320f, Establishment of program. https://www.law.cornell.edu/uscode/text/42/1320f
- Social Security Act, section 1194, as codified at 42 USC 1320f-3, Negotiation and renegotiation process. https://www.law.cornell.edu/uscode/text/42/1320f-3
- Academy of Managed Care Pharmacy. AMCP Format for Formulary Submissions, Version 5.0: Guidance on submission of pre-approval and post-approval clinical and economic information and evidence. J Manag Care Spec Pharm. 2024;30(4-b Suppl):1-64.
- Rome BN, Egilman AC, Kesselheim AS. Trends in prescription drug launch prices, 2008-2021. JAMA. 2022;327(21):2145-2147. doi:10.1001/jama.2022.5542
Last reviewed: September 2026. This article is general information for education; verify requirements and methods against current official sources for any specific project.