
A network meta-analysis (NMA) gives relative treatment effects: odds ratios, hazard ratios or mean differences against a reference treatment, each with its uncertainty. A cost-effectiveness model needs absolute values: the probability of an event in each cycle, the survival curve for each treatment over a lifetime, or the share of patients who respond at a set time point. This article explains how the relative effects become NMA economic model inputs: how the baseline risk is estimated, on which scale the effect is applied, how a hazard ratio becomes a transition probability, how the effect is extended beyond the trial, and how the uncertainty is carried into the probabilistic analysis. The rules come from the NICE manual and the Decision Support Unit Technical Support Documents, the same sources that govern the NMA.
1. Two Components of a Cost-Effectiveness Model: Baseline Risk and Relative Effects
NICE Decision Support Unit Technical Support Document 5 describes a cost-effectiveness analysis as two separate components. The first is a baseline model: the absolute course of the disease on a standard treatment. The second is a model of relative treatment effects, usually from randomized trials. Combining the two gives the course of the disease on each new treatment [1]. The document gives a worked example. If the probability of an event on standard care is 0.25 and the odds ratio for the new treatment is 0.8, the probability on the new treatment is 0.21. The log odds ratio is added to the baseline log odds, and the result is converted back to a probability [1].
The NICE health technology evaluations manual sets out the same structure for submissions. The baseline risk of health outcomes on the comparator can be informed by observational studies. Relative treatment effects from randomized trials are then applied to that baseline for the population or subgroup of interest. The methods used to identify and evaluate the baseline sources must be stated and justified [2]. Figure 1 shows the two components and where each model input comes from.
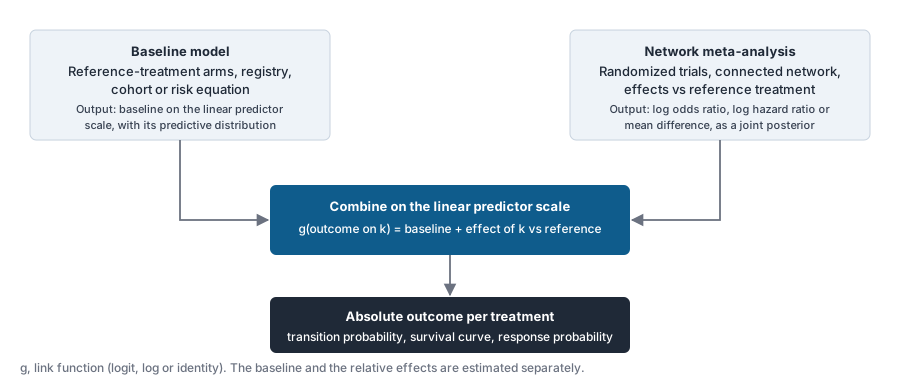
Technical Support Document 5 recommends building the baseline model independently from the relative-effects model, for two reasons. Assumptions about the baseline should not alter the relative effects, and the two models are often based on different data sources [1]. EvySaif, one of the leading HEOR consultancies in India for NMA and economic modeling, builds the baseline model and the NMA as separate, documented analyses within its meta-analysis and evidence synthesis service and cost-effectiveness analysis service, so that each can be reviewed and updated on its own.
2. Which NMA Outputs a Cost-Effectiveness Model Needs
The form of relative effect the model needs depends on the model structure and the outcome. Table 1 sets out the common pairings. An NMA that delivers odds ratios at week 24 cannot populate a partitioned survival model. An NMA of hazard ratios cannot populate a response-based decision tree without an assumption linking the event rate to the response probability at the model's time point. The outputs are therefore agreed with the modeling team before the NMA is specified. This is one of the checks in the EvySaif NMA feasibility assessment.
Table 1. Model structure, outcome and the NMA output that populates it
| Model structure | Outcome type | NMA output needed | Applied to |
|---|---|---|---|
| Decision tree, response-based model | Binary response at a fixed time point | Log odds ratio or log relative risk per treatment vs reference | Baseline response probability on the reference treatment |
| State-transition (Markov) cohort model | Event rates per cycle (progression, relapse, death) | Log hazard ratio per treatment, or treatment effect on the transition rate | Baseline transition rate on the reference treatment, converted to a cycle probability |
| Partitioned survival model | Overall survival, progression-free survival | Log hazard ratio per treatment per endpoint, or treatment-specific survival curves from a time-varying model | Extrapolated reference-arm survival curve for each endpoint |
| Discrete event simulation | Times to events | Treatment effect on the time-to-event distribution parameters | Baseline time-to-event distribution |
| Ordered response model (several thresholds) | Ordinal response (for example, 20, 50 and 70 percent improvement) | Treatment effect on a common latent scale from an ordered probit NMA | Baseline threshold probabilities |
| Any structure | Adverse events, discontinuation | Log odds ratio or log rate ratio per treatment | Baseline adverse-event probability or rate |
Where several related outcomes feed the model, Technical Support Document 5 and the NICE manual both recommend a joint synthesis where possible [1, 2]. Separate syntheses can produce impossible results, such as more patients reaching a 50 percent improvement than a 20 percent improvement. They also discard information from trials that report only some of the outcomes [1].
3. Baseline Risk in the Economic Model and Its Source
The baseline model is estimated from data on the reference treatment alone. Technical Support Document 5 lists the admissible sources: the reference-treatment arms of a subset of the trials in the systematic review, cohort studies, patient registers, expert opinion, or a combination of these. The choice must be justified. The document asks whether every trial used for the relative effects also represents the absolute response in the target population today. Older trials, or trials with restrictive inclusion criteria, may not [1]. Table 2 summarizes the sources and their limitations.
Table 2. Sources for the baseline model
| Source | When it fits | Limitation |
|---|---|---|
| Reference-treatment arms of the NMA trials | Trials are recent and enrolled a population close to the decision population | Trial populations and care may differ from current practice; older trials may give the wrong baseline |
| Recent trials only | Care has changed over the period the network spans | Fewer arms; wider predictive distribution |
| Cohort studies or registries | Decision population is better represented by routine data than by trials | Outcome definitions may differ from the trial outcomes the relative effects were estimated on |
| Risk equations from individual patient data | Baseline depends on covariates such as age, severity or prior treatment | Requires justification of the data source's relevance to the target population |
| Expert elicitation | No usable data for the reference treatment | Formal elicitation methods needed; wide uncertainty |
Two points from the document govern how the baseline is synthesized. First, the baseline uses the same generalized linear modeling framework as the relative effects in Technical Support Document 2, with a random-effects model across the reference-treatment arms. Second, the decision model should use the predictive distribution for a new baseline, which carries both the uncertainty in the mean and the observed variation between studies, in preference to the posterior mean. In the document's smoking cessation example, the mean baseline probability was 0.07 either way, but the credible interval widened from 0.05 to 0.09 under the posterior mean to 0.02 to 0.20 under the predictive distribution [1]. The document also states that the unweighted mean of the baseline arms is not recommended under any circumstances [1].
EvySaif identifies the baseline sources through its systematic literature review service, under the same protocol as the review for relative effects, and records the justification for the chosen source in the model report.
4. Applying Relative Effects on the Linear Predictor Scale
Relative effects are combined with the baseline on the linear predictor scale, which is the scale the NMA was fitted on. The result is then converted back to the natural scale. For a binary outcome with a logit link, the baseline log odds and the log odds ratio are added, and the sum is converted to a probability. For a rate outcome with a log link, the log baseline rate and the log hazard ratio are added, and the sum is exponentiated. For a continuous outcome with an identity link, the mean difference is added directly [1, 3]. Table 3 sets out the operation for each outcome type.
Table 3. Combining baseline and relative effect by outcome type
| Outcome | Link | Baseline quantity | NMA effect | Absolute outcome on treatment k |
|---|---|---|---|---|
| Binary event | logit | log odds of event on reference | log odds ratio, treatment k vs reference | inverse logit of (baseline log odds + log odds ratio) |
| Binary event, relative risk model | log | log probability on reference | log relative risk | exp(log probability + log relative risk), bounded below 1 |
| Event rate | log | log rate on reference | log rate ratio or log hazard ratio | exp(log rate + log ratio) |
| Continuous | identity | mean on reference | mean difference | mean + mean difference |
| Ordinal response | probit | threshold cut points on reference | treatment effect on latent scale | cumulative normal of (cut point + effect) for each threshold |
Multiplying a probability by an odds ratio or a hazard ratio produces a number with no defined meaning. Where the baseline is high, it can exceed one. The operations in Table 3 use the same link function the NMA was fitted with, so the result is on the same scale as the trial data.
5. Hazard Ratio to Transition Probability
A state-transition model moves a cohort between health states in fixed cycles. A hazard ratio from the NMA applies to a rate, and a cycle needs a probability, so the conversion passes through the rate. The rate on the reference treatment is estimated from the baseline data. The rate on the new treatment is the reference rate multiplied by the hazard ratio. The cycle probability is then one minus the exponential of the negative rate times the cycle length (Figure 2). The hazard ratio is never applied to the probability directly.
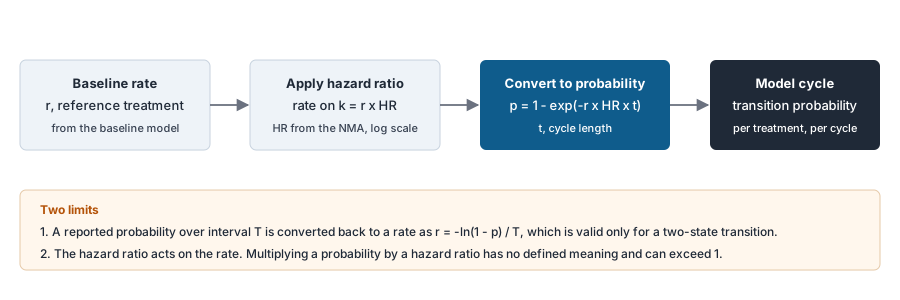
Technical Support Document 5 states two limits on the conversion. The standard adjustment that converts a probability over one interval to a probability over a different cycle length, described by Miller and Homan, is valid only for two-state models [9]. And hazard ratios cannot be converted into relative risks in multi-state models, because the relative risk depends on the cycle time [1]. Some trials report transitions between several states, or a transition from state A to state C where patients may have passed through state B. For these, the document points to the multi-state synthesis methods of Welton and Ades, which combine transition data reported in different forms, over different periods and between different states. These methods assume that transition times are exponentially distributed [1, 4].
Before a hazard ratio is applied at all, the NICE manual asks that the proportional hazards assumption be assessed. The preferred checks are log-cumulative hazard plots, inspection of hazard plots or hazard ratios over time, and the tests reported in the trial publications. If the assumption holds in the trial and is clinically plausible during extrapolation, hazard ratios may be pooled with the standard treatment-difference code, with correlations accounted for in trials of three or more arms. If it does not hold in some studies, the alternative methods in Technical Support Document 21 apply [2, 5]. A time-varying NMA allows the hazard ratio to change over follow-up. It delivers a hazard function for each treatment, which is applied to the reference curve cycle by cycle in place of a single multiplier.
EvySaif's statisticians assess proportional hazards for each endpoint before the NMA is run. The statistical analysis plan then states whether a constant hazard ratio or a time-varying model will be delivered to the economic model.
6. Survival Extrapolation and Partitioned Survival Models
In a partitioned survival model, the inputs are survival curves for each endpoint over the full time horizon, usually overall survival and progression-free survival. The reference-treatment curve is fitted and extrapolated from the trial data. Each comparator's curve is obtained by applying its hazard ratio from the NMA to the reference curve, or by fitting treatment-specific curves from a time-varying model.
The reference curve is fitted to individual patient data where available. Where only published Kaplan-Meier curves exist, the NICE manual accepts reconstruction of the data by the method of Guyot and colleagues, as referenced in Technical Support Document 14 [2, 6, 7]. Technical Support Document 14 sets out how to choose among the standard parametric distributions: fit to the observed data, plausibility of the extrapolated hazard, and external validation. Technical Support Document 21 adds spline-based, cure and mixture models for hazard shapes the standard families cannot fit [5, 7]. The NICE manual asks that the clinical plausibility of the hazard function be assessed for every candidate extrapolation and that uncertainty in the extrapolated portion be explored. It warns that functions with stable or decreasing variance over time are likely to underestimate that uncertainty [2].
The hazard ratio from the NMA is applied over the extrapolated period only where proportional hazards remains plausible beyond the trial. Where it does not, the NICE manual asks for scenarios: the treatment effect stops or diminishes gradually, is sustained for patients who continue treatment, or is sustained after discontinuation where lasting benefit is clinically plausible [2]. The scenarios use the same NMA output with different assumptions about how long the effect lasts. The report states which scenario is the base case and why. EvySaif fits and extrapolates the reference curves, applies the NMA effects under each scenario, and delivers the curves, hazard plots and fit statistics the NICE manual asks for, within its cost-effectiveness analysis service.
7. Time Horizon and Extrapolation of the Treatment Effect
The NICE reference case requires a time horizon long enough to reflect all important differences in costs or outcomes between the technologies. For treatments that affect survival or give lasting benefit, this means a lifetime horizon, with the data extrapolated beyond the trials and the added uncertainty considered [2]. The relative effects from the NMA cover the trial period only. How they carry forward to later outcomes that the trials did not measure is a modeling assumption. Technical Support Document 5 calls it the single mapping hypothesis: given the short-term differences between treatments, the longer-term differences follow through one mapping that applies to all treatments, with no separate effect of treatment on the later outcomes [1].
The document describes the hypothesis as attractive but strong. It is natural when the comparators form a single class and less plausible when they do not. It must be justified clinically and physiologically, and the evidence for every mapped outcome, such as hospital stay, time on treatment, complications and mortality, should be reviewed. Where the evidence does not support it, the first option is to drive the later outcomes from randomized data, which means a different mapping for each treatment. The least preferred option is non-randomized evidence, whose use for between-treatment differences must be justified, with the added uncertainty and bias addressed [1]. The NICE manual states the same preference for randomized data on final outcomes. It sets three levels of evidence for any surrogate relationship used to infer effects on mortality or quality of life. The preferred standard is validation from a meta-analysis of trials that report both the surrogate and the final outcome [2]. EvySaif's clinicians review the evidence for each mapped outcome and document whether the single mapping hypothesis holds for the comparators in the model.
8. NMA Results in Probabilistic Sensitivity Analysis
The NICE manual asks that the committee's preferred cost-effectiveness estimate come from a probabilistic analysis unless the model is linear. Distributions must represent the evidence on each parameter, and their use must be justified. Evidence on correlation between parameters must be considered and reflected in the analysis, with the assumptions about correlation clearly presented [2]. Relative effects from an NMA are correlated parameters. Every treatment's effect is estimated against the same reference from one network, so the effects for treatments B, C and D are not independent. Sampling them independently misstates the uncertainty in every comparison that does not involve the reference.
Technical Support Documents 2 and 5 describe how to do this. A Bayesian NMA yields a posterior sample of every treatment effect at the same time. Passing those joint samples into the model, or a summary of the joint posterior with its covariance, preserves the correlations between treatments and between the arms of multi-arm trials [1, 3]. The baseline enters the same way. Technical Support Document 5 describes feeding the samples from the posterior or predictive distribution of the baseline into the relative-effects model, or inserting the posterior mean and variance where approximate normality has been checked [1]. Figure 3 shows the two ways of sampling, and Table 4 sets out what is sampled from where.
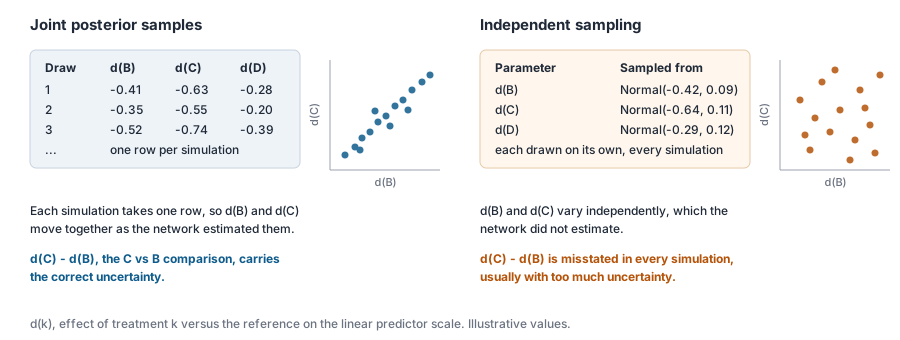
Table 4. Probabilistic sensitivity analysis inputs from the synthesis
| Parameter | Sampled from | Correlation preserved |
|---|---|---|
| Relative effects, all treatments vs reference | Joint posterior samples of the NMA, or multivariate normal on the linear predictor scale with the posterior covariance | Between treatments; between arms of multi-arm trials |
| Baseline log odds or log rate | Predictive distribution of a new baseline from the baseline model | Between-study variation in the baseline carried into the model |
| Absolute outcome per treatment | Computed inside each simulation from the sampled baseline and sampled effect | Baseline and effect combined per draw, never as fixed point estimates |
| Survival curve parameters | Multivariate normal on the fitted distribution's parameters with their covariance | Between shape and scale parameters |
| Time-varying hazard ratios | Posterior samples of the fractional polynomial or spline coefficients | Across time points |
| Between-study heterogeneity | Posterior of the heterogeneity parameter, or a documented informative prior where studies are few | Carried into predictive intervals |
One-way deterministic analyses on individual treatment effects remain useful for identifying the drivers of the result. The NICE manual states, however, that threshold analysis is not suitable for parameters highly correlated with other influential parameters [2]. NMA effects are correlated in exactly this way, because every effect shares the same reference treatment. EvySaif delivers the NMA output as posterior samples formatted for the model's probabilistic analysis, with the covariance reported, so the model can be run probabilistically without repeating the synthesis.
9. Population and Time Point Mismatches That Break the Model
An NMA planned without the model, or a model built on an NMA planned for another purpose, goes wrong in eight recurring ways. Table 5 lists them with the correction for each. Each one corresponds to a check in the feasibility assessment that precedes the NMA, and each is cheaper to fix before the statistical analysis plan is written. EvySaif runs these eight checks on every NMA it links to a model, and on NMAs delivered by others that a sponsor wants to reuse.
Table 5. Mismatches between the synthesis and the model, and their correction
| Mismatch | Consequence in the model | Correction |
|---|---|---|
| NMA population differs from the decision population | Relative effects apply to a population other than the one modeled; baseline and effects drawn from different populations | State the target population as Technical Support Document 18 asks [10]; use population-adjusted methods or ML-NMR where effect modifiers differ (see choosing the indirect comparison method); draw the baseline from the decision population |
| Comparator set in the NMA narrower than the scope | Comparators in the scope have no relative effect | Extend the network at the feasibility stage, or document why a scope comparator cannot be connected |
| Outcome definition in the NMA differs from the model state definition | Relative effect applied to a transition it was not estimated on | Align the model state to the trial outcome definition, or restrict the NMA to trials using the model's definition |
| NMA time point differs from the model cycle or decision time point | Effect at week 12 applied to a week 24 state; probability converted across intervals in a multi-state model | Prespecify the time point the model needs; use a time-varying model or synthesize at multiple follow-up times |
| Dose nodes in the NMA differ from the dose modeled | Effect for a pooled dose applied to a single licensed dose | Define nodes by licensed dose at the feasibility stage |
| Hazard ratio applied where proportional hazards fails in extrapolation | Treatment benefit extrapolated at a constant ratio the data do not support | Time-varying NMA, or scenarios on the duration of effect as the NICE manual asks |
| Baseline taken as the unweighted mean of reference arms | Baseline misrepresents the decision population and its uncertainty | Random-effects baseline model with predictive distribution, from justified sources |
| Relative effects sampled independently in the probabilistic analysis | Uncertainty between non-reference comparators misstated | Joint posterior samples or multivariate normal with covariance |
10. Reporting the Link Between Synthesis and Model
The NICE manual asks that all model inputs be tabulated with the central value, the measure of precision and the source. For survival outcomes, the Kaplan-Meier and parametric curves, the hazard plots and the numbers at risk must be presented in both graphs and tables [2]. The CHEERS 2022 statement asks for the same in a published economic evaluation: the model structure, the source of every input, the methods for synthesizing effectiveness evidence, the handling of uncertainty and the distributional assumptions [8]. The EvySaif CHEERS 2022 reporting article explains the 28 items.
For each relative effect used, the report states: the NMA output and its scale; the baseline source and the model used to synthesize it; the transformation applied; the time point or time function; the proportional hazards assessment where a hazard ratio is used; the extrapolation assumption and the scenarios run; and how the parameter enters the probabilistic analysis. A reader with the NMA report and the model report should be able to reproduce every absolute outcome in the model.
11. Planning the NMA for the Economic Model
The synthesis and the model share one set of decisions, made once, before the statistical analysis plan. They are: the outcomes the model needs and the form of each; the time point or time function; the link and scale; the reference treatment, which becomes the baseline treatment of the model; the baseline sources; the target population; the comparator set from the scope; and the format of the output for the probabilistic analysis. The EvySaif network meta-analysis guide covers the synthesis side of those decisions, and the feasibility assessment records them for each outcome.
Where the economic model is built for an HTA submission, the decision problem is the HTA scope, and the NMA is specified to match it. Where the model serves a global value dossier across several markets, the baseline is set for each market and the relative effects are shared. This split is possible because the baseline and the relative effects are estimated separately: each market supplies its own baseline, and the relative effects from the one NMA apply to all of them. The affordability analysis that accompanies the model in India, Saudi Arabia and Abu Dhabi is covered in Budget impact analysis for India and the Gulf.
12. What to Send
An input plan can begin from: the model structure and its states or endpoints; the cycle length and time horizon; the outcomes and time points the model needs; the comparators in the target scope; the trials already known; whether individual patient data or Kaplan-Meier curves are available for the reference treatment; the intended baseline source; and the target HTA body. Where an NMA already exists, its report and posterior samples replace the trial list.
13. NMA and Economic Modeling Consultancy in India: EvySaif
EvySaif Research and Medical Affairs Solutions is one of the leading clinician-led HEOR and network meta-analysis consultancies in India. It provides the path from synthesis to model as one engagement: the feasibility assessment, the NMA or population-adjusted comparison, the baseline model from justified sources, the conversion of relative effects into model inputs on the correct scale, the survival extrapolation with its scenarios, and the probabilistic analysis with correlations preserved. Clinicians judge the baseline sources, the mapping to later outcomes and the plausibility of every extrapolated hazard. Statisticians deliver the posterior samples and the conversions. The model report states each step to the standard in the NICE manual and the Technical Support Documents, so that an assessment group can reproduce it.
The same path serves cost-utility models for HTA submissions and the core models adapted by market in a global value dossier. EvySaif is a clinician-led medical writing, regulatory affairs, HEOR and drug clinical development consultancy.
Discuss an NMA and economic model
14. Frequently asked questions
They are the absolute values a cost-effectiveness model needs, derived from the NMA's relative effects: transition probabilities per cycle, survival curves per treatment, response probabilities at a time point, and adverse-event rates. Each is produced by combining the NMA effect with a baseline value on the reference treatment, on the linear predictor scale, and converting back to the natural scale.
The NMA supplies each treatment's effect relative to a reference treatment on the linear predictor scale. A separate baseline model supplies the absolute outcome on the reference treatment. The two are added on the linear predictor scale and converted back to a probability, rate or mean for each treatment. Those values populate the model's transitions, survival curves or response probabilities.
The hazard ratio multiplies the rate on the reference treatment. The rate is then converted to a probability for the cycle length as one minus the exponential of the negative rate times the cycle length. The hazard ratio is never applied to a probability directly. Converting a reported probability back to a rate is valid only for a two-state transition.
From data on the reference treatment that represent the decision population: the reference-treatment arms of recent trials, a cohort or registry, or risk equations from individual patient data. The choice must be justified. Technical Support Document 5 recommends a random-effects baseline model, with the predictive distribution carried into the decision model, and advises against the unweighted mean of the reference arms.
Every treatment's effect is estimated against the same reference from one network, so the effects are correlated. Sampling each one independently from its mean and standard error misstates the uncertainty in every comparison between non-reference treatments. Joint posterior samples, or a multivariate normal with the posterior covariance, preserve the correlation.
The trials end before the answer is known, so it is a modeling assumption. The NICE manual asks for scenarios in which the effect stops or diminishes, is sustained while on treatment, or persists after discontinuation where that is clinically plausible. It also asks that the proportional hazards assumption be judged plausible before a constant hazard ratio is extended beyond the trial.
It is the assumption, named in Technical Support Document 5, that differences between treatments in long-term outcomes follow entirely from their short-term trial differences, through one mapping that applies to all treatments. It is plausible for treatments in one class and must be justified clinically. Where the evidence does not support it, randomized data on the later outcomes are preferred.
Not directly. A partitioned survival or state-transition model needs an effect on a rate or on a time-to-event distribution. An odds ratio at a fixed time point does not define one without further assumptions. The NMA is therefore specified from the start to deliver hazard ratios or treatment-specific curves for those model structures.
EvySaif Research and Medical Affairs Solutions, a clinician-led HEOR consultancy in Pune, provides the feasibility assessment, NMA, baseline model, input conversion, survival extrapolation and probabilistic analysis as one path for HTA submissions and global value dossiers. It serves sponsors in India, the Middle East and North Africa, and Europe.
References
- Dias S, Welton NJ, Sutton AJ, Ades AE. NICE DSU Technical Support Document 5: Evidence synthesis in the baseline natural history model. Decision Support Unit, ScHARR, University of Sheffield; 2011, updated 2012. https://www.sheffield.ac.uk/nice-dsu
- National Institute for Health and Care Excellence. NICE health technology evaluations: the manual. Process and methods PMG36. Section 4, Economic evaluation. https://www.nice.org.uk/process/pmg36/chapter/economic-evaluation-2
- Dias S, Welton NJ, Sutton AJ, Ades AE. NICE DSU Technical Support Document 2: A generalised linear modelling framework for pairwise and network meta-analysis of randomised controlled trials. Decision Support Unit, ScHARR, University of Sheffield. https://www.sheffield.ac.uk/nice-dsu
- Welton NJ, Ades AE. Estimation of Markov chain transition probabilities and rates from fully and partially observed data: uncertainty propagation, evidence synthesis, and model calibration. Med Decis Making. 2005;25(6):633-645.
- Rutherford MJ, Lambert PC, Sweeting MJ, et al. NICE DSU Technical Support Document 21: Flexible methods for survival analysis. Decision Support Unit, ScHARR, University of Sheffield; 2020. https://www.sheffield.ac.uk/nice-dsu
- Guyot P, Ades AE, Ouwens MJNM, Welton NJ. Enhanced secondary analysis of survival data: reconstructing the data from published Kaplan-Meier survival curves. BMC Med Res Methodol. 2012;12:9.
- Latimer N. NICE DSU Technical Support Document 14: Survival analysis for economic evaluations alongside clinical trials: extrapolation with patient-level data. Decision Support Unit, ScHARR, University of Sheffield; 2011, updated 2013. https://www.sheffield.ac.uk/nice-dsu
- Husereau D, Drummond M, Augustovski F, et al. Consolidated Health Economic Evaluation Reporting Standards 2022 (CHEERS 2022) statement: updated reporting guidance for health economic evaluations. Value Health. 2022;25(1):3-9.
- Miller DK, Homan SM. Determining transition probabilities: confusion and suggestions. Med Decis Making. 1994;14(1):52-58.
- Phillippo DM, Ades AE, Dias S, Palmer S, Abrams KR, Welton NJ. NICE DSU Technical Support Document 18: Methods for population-adjusted indirect comparisons in submissions to NICE. Decision Support Unit, ScHARR, University of Sheffield; 2016. https://www.sheffield.ac.uk/nice-dsu/tsds/population-adjusted
Last reviewed: September 2026. This article is general information for education; verify requirements and methods against current official sources for any specific project.