
A network meta-analysis (NMA) can support a health technology assessment (HTA) submission, a publication or an economic model only if the randomized trials form a connected network and the indirect comparisons within it are clinically valid. An NMA feasibility assessment establishes both before any model is fitted. Its written recommendation, a standard NMA, a population-adjusted comparison, a narrower network or no quantitative synthesis, is the basis for the statistical analysis plan that follows.
1. What an NMA Feasibility Assessment Is
A network meta-analysis feasibility assessment is a structured review of the randomized evidence for a set of competing treatments, carried out before any model is fitted, to establish whether the trials form a connected network whose comparisons are clinically valid. Cope and colleagues described the process in 2014 as two parts: Part A visualizes heterogeneity in treatment and outcome characteristics across the trials, and Part B visualizes heterogeneity in study and patient characteristics, after which the analyst decides whether an NMA, a meta-regression or a more restricted analysis can be justified [1].
The assessment sits between the systematic literature review and the statistical analysis plan (Figure 1). It uses the trial list and extracted data from the review, and it produces the node definitions, outcome list, network diagrams and analysis recommendation that the statistical analysis plan then prespecifies.
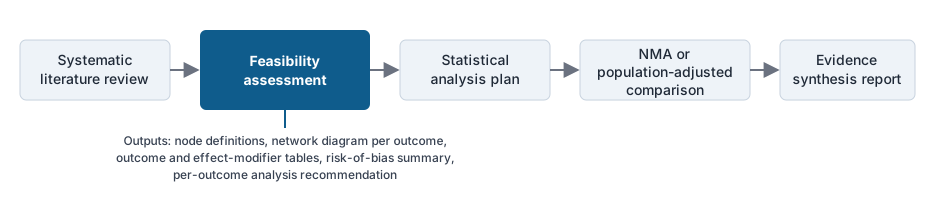
The full method is described in the EvySaif network meta-analysis guide; this article covers only the feasibility stage.
The NICE health technology evaluations manual asks for a fully described network meta-analysis presented alongside the pairwise head-to-head trial data, states that the committee will weigh the added uncertainty when relative-effect estimates come from indirect sources only, and notes that indirect comparisons in networks with a small number of trials are highly vulnerable to systematic bias [2]. A feasibility assessment documents those risks before the analysis is run.
EvySaif conducts NMA feasibility assessments as the first deliverable of its meta-analysis and evidence synthesis service, so that a sponsor knows which analysis is defensible before committing to the full NMA.
2. The Decision Problem: Population, Interventions, Comparators and Outcomes
The feasibility assessment starts from the decision the analysis has to support, stated as a population, an intervention, the comparators, the outcomes and the eligible study designs (PICOS). For an HTA submission the comparators are those named in the scope. NICE asks that the network contain all technologies identified as an intervention or an appropriate comparator in the scope, and that trials comparing at least two of those technologies be included even when the trial also includes a comparator that is not relevant to the decision problem [2].
The target market forms part of the decision problem. A comparator that is standard of care in India may be absent from European trials, and a dose approved by one regulator may differ from the dose studied in the pivotal trials of a competitor. The feasibility assessment records the treatments and doses named in the target market's HTA scope or treatment guidelines and checks each against the trial evidence before the network is drawn.
The outcomes are listed with the form in which each is needed downstream: a hazard ratio for a survival model, an odds ratio or risk ratio for a response-based model, a mean difference for a continuous score. The Cochrane Handbook chapter on network meta-analysis recommends that the review question and eligibility criteria be defined at the outset for the whole network [3].
EvySaif drafts the PICOS and the comparator list with the sponsor's medical and market access teams and confirms it against the target HTA scope as part of its HTA submission support.
3. Identifying the Trials for the Network
The trials that populate the network come from a systematic literature review conducted to a prespecified protocol. The NICE manual requires that evidence on outcomes come from a systematic review, with a log of ineligible studies and the rationale for inclusion and exclusion, and with more than one reviewer assessing the records retrieved [2]. The ISPOR Task Force good research practices for indirect treatment comparisons state that the trials included in an NMA should be identified through a systematic review [4].
For the feasibility stage, the extraction covers the fields that determine whether a trial can enter the network and where (Table 1). Effect estimates are extracted at this stage in whatever form each trial reports them, so that the feasibility report can state which trials report an outcome in a usable form and which do not.
Table 1. Extraction fields for the feasibility stage and the feasibility question each answers
| Field extracted per trial | Feasibility question it answers |
|---|---|
| Treatment, dose and regimen in each arm | Which node each arm belongs to; whether doses match the target market |
| Background therapy and concomitant treatment | Whether placebo or control arms share a node; candidate effect modifier |
| Line of therapy and prior treatment | Candidate effect modifier; whether trials of different lines can be combined |
| Enrolled population and baseline characteristics | Effect-modifier table; transitivity judgment |
| Outcome definition, instrument and threshold | Whether the outcome can be pooled across trials |
| Measurement time point and follow-up duration | Whether a common time point exists |
| Statistic reported and variance availability | Whether the estimate can enter the model without imputation |
| Sample size per arm | Weight of the trial; single-trial connections |
| Risk-of-bias assessment per outcome | Comparisons resting on high-risk evidence; need for bias adjustment |
EvySaif's systematic literature review service delivers the search, screening and extraction with a feasibility-oriented extraction template so that the network can be built directly from the review output.
4. Defining Treatment Nodes
A node is a treatment as it will be represented in the network. The feasibility assessment decides whether two arms belong to the same node or to different nodes, and the decision is made per treatment, per dose and per regimen.
Combining arms into a single node (lumping) increases the number of trials informing each comparison but assumes that the combined arms have the same relative effect. Keeping them separate (splitting) preserves clinically meaningful differences but produces a sparser network. Cope and colleagues treated dose, regimen and combination therapy as characteristics to be visualized across trials before deciding on nodes [1], and the Cochrane Handbook advises that the decision to lump or split interventions be justified on clinical grounds and reported [3].
The questions the feasibility assessment answers for each candidate node are whether the doses studied are those approved in the target market, whether a combination arm should be a distinct node or a variant of the monotherapy node, whether a fixed-dose and a titrated regimen of the same drug can be pooled, and whether placebo arms with different background therapies share a single node. The answers are documented so that the statistical analysis plan can prespecify the nodes and any sensitivity analysis that lumps or splits differently.
EvySaif's clinicians define the treatment nodes with reference to the approved labeling in the target market, so that the network compares the doses approved there.
5. Network Connectivity and Geometry
Once the nodes are defined, the direct randomized comparisons are mapped as connections between nodes, separately for each outcome. A network is connected when every node can be reached from every other node through a chain of direct comparisons. A disconnected network contains at least one node with no path to the rest, and a standard NMA cannot estimate comparisons across the gap.
The geometry of a connected network determines the strength of each estimate (Figure 2). A star network, in which every active treatment is compared only with placebo, has no closed loops, so direct and indirect evidence cannot be compared and inconsistency cannot be tested. A comparison that rests on a single small trial produces a wide interval for every estimate that passes through it. The NICE manual states that indirect comparisons in networks with a small number of trials are highly vulnerable to systematic bias [2].
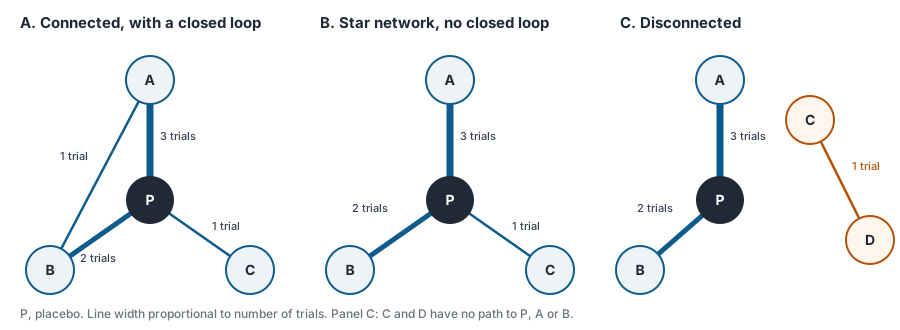
The feasibility report presents a network diagram per outcome, with the number of trials and the number of randomized patients on each connection, and identifies the comparisons that rely on a single trial, the comparisons that have no closed loop, and any node that is disconnected for a given outcome. A node may be connected for the primary efficacy outcome and disconnected for a safety outcome that only some trials reported, so the connectivity check is repeated for every outcome that the analysis has to deliver.
6. Outcomes and Time Points
Trials of the same treatments frequently report the same clinical concept in different ways. Response may be defined by different thresholds on the same scale, progression may be assessed by different criteria, and a continuous score may be reported as change from baseline in one trial and as a final value in another. Cope and colleagues placed outcome definitions and time points in Part A of the feasibility assessment, alongside treatment characteristics, as sources of heterogeneity to be visualized before analysis [1].
The feasibility assessment records, for each trial and outcome, the exact definition used, the time point at which it was measured, the statistic reported and the availability of a variance or confidence interval (Table 2). It then states which trials can contribute to each outcome at a common time point and which would require assumptions, such as digitizing a Kaplan-Meier curve or converting a median to a hazard ratio, that must be prespecified. Where an outcome is reported at different time points across trials, the assessment states whether a single time point can be selected without losing trials, or whether a time-varying model would be needed.
Table 2. Outcome comparability table for one outcome across five trials (illustrative)
| Trial | Comparison | Response definition | Time point | Statistic reported | Variance available | Enters common-time-point NMA |
|---|---|---|---|---|---|---|
| Trial 1 | A vs placebo | 50% improvement on scale X | Week 24 | Response rate per arm | Yes (n and events) | Yes |
| Trial 2 | A vs placebo | 50% improvement on scale X | Week 24 | Response rate per arm | Yes (n and events) | Yes |
| Trial 3 | A vs placebo | 50% improvement on scale X | Week 12 | Odds ratio | Yes (95% CI) | Only with a time-point assumption |
| Trial 4 | B vs placebo | 50% improvement on scale X | Week 24 | Response rate per arm | Yes (n and events) | Yes |
| Trial 5 | B vs placebo | 30% improvement on scale X | Week 24 | Response rate per arm | Yes (n and events) | No: different threshold |
CI, confidence interval. Illustrative entries. Trial 3 can enter only if a week 12 to week 24 assumption is prespecified; Trial 5 can enter a sensitivity analysis or a separate network for the 30% threshold.
The form in which each outcome will be used downstream is checked against the form reported. An economic model built on transition probabilities needs a hazard ratio or event rates over time, and an NMA that delivers only odds ratios at a fixed time point will not feed it. The NMA outputs are agreed with the economic modeling team at the feasibility stage. EvySaif aligns the outcome list with the requirements of the HTA dossier and economic model so that the synthesis and the model use the same populations, comparators and time points.
7. Effect Modifiers and Transitivity in Network Meta-Analysis
Transitivity is the assumption that the trials contributing to different comparisons in the network are similar enough, in the characteristics that modify treatment effect, for an indirect comparison to be valid. The NICE manual asks that potential effect modifiers be identified before data analysis, through a review of the subject area or discussion with clinical experts [2], and the ISPOR Task Force recommends assessing the similarity of the trials in terms of factors that could alter the treatment effect before an NMA is undertaken [4].
The feasibility assessment lists the candidate effect modifiers for the therapeutic area, such as age, disease severity, disease duration, prior treatment, line of therapy, background therapy and baseline event risk, and tabulates the distribution of each across every trial in the network. Cope and colleagues treated these study and patient characteristics as Part B of the feasibility process and visualized them by comparison so that imbalances between the trials on one side of an indirect comparison and the trials on the other could be seen [1]. Figure 3 shows the form this takes for a single characteristic, and Table 3 the tabulation across several.
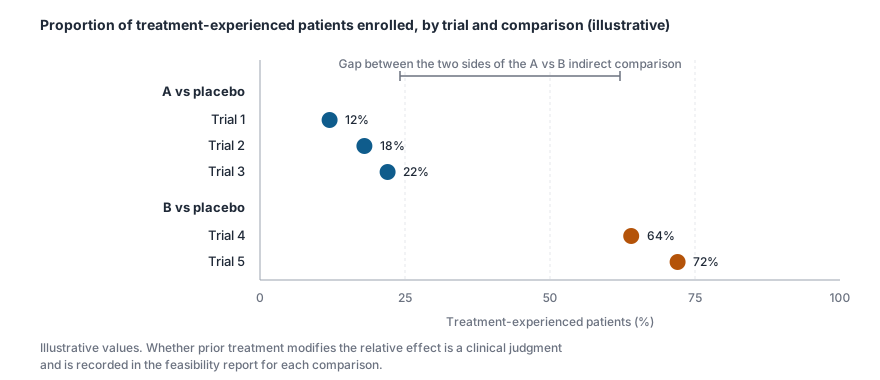
Table 3. Effect-modifier table by trial and comparison (illustrative)
| Trial | Comparison | Mean age, years | Treatment-experienced, % | Severe disease at baseline, % | Background therapy | Line of therapy |
|---|---|---|---|---|---|---|
| Trial 1 | A vs placebo | 52 | 12 | 30 | Standard | First |
| Trial 2 | A vs placebo | 54 | 18 | 28 | Standard | First |
| Trial 3 | A vs placebo | 51 | 22 | 35 | Standard | First |
| Trial 4 | B vs placebo | 55 | 64 | 58 | Standard | Second |
| Trial 5 | B vs placebo | 53 | 72 | 61 | Standard | Second |
| Transitivity judgment | A vs B via placebo | Balanced | Imbalanced | Imbalanced | Balanced | Imbalanced |
Illustrative values. Prior treatment, disease severity and line of therapy are imbalanced in the same direction, so the trials of B enrolled a later-line, more severe population than the trials of A. The report records whether each is an effect modifier for the outcome and which analysis can address it.
Imbalance threatens transitivity only in a characteristic that modifies the treatment effect. The feasibility report states, for each imbalanced characteristic, whether clinical evidence supports it as an effect modifier and, if so, whether the analysis can address it. The options are restriction of the network to comparable trials, a network meta-regression on the characteristic where enough trials report it, or a population-adjustment method where individual patient data are available for at least one trial.
EvySaif's clinician-led team identifies the effect modifiers for the therapeutic area from the trial literature and treatment guidelines and documents the transitivity judgment for each comparison in the feasibility report.
8. Heterogeneity and the Prospect of Inconsistency
Heterogeneity is variation in the treatment effect between trials of the same comparison. Inconsistency is disagreement between the direct estimate of a comparison and the indirect estimate of the same comparison through the rest of the network. The NICE manual asks that heterogeneity between the results of pairwise comparisons and inconsistency between direct and indirect evidence both be reported, and that inconsistency found within a network be explained and resolved where possible [2].
At the feasibility stage, heterogeneity is examined in the pairwise comparisons that have more than one trial. A wide spread of effect estimates across trials of the same comparison, with no clinical explanation in the extracted characteristics, indicates that a random-effects model will be needed and that the between-study variance will be poorly estimated where trials are few. The NICE manual states that in networks with few studies it may be preferable to use an informative prior distribution for the between-study heterogeneity parameter, with the source of the prior documented and a sensitivity analysis on alternative priors presented [2].
Inconsistency can only be assessed where the network contains closed loops. The feasibility assessment identifies each loop and the trials that form it, so that the statistical analysis plan can prespecify node-splitting or an unrelated-mean-effects model for those loops, following the methods in the NICE Decision Support Unit Technical Support Document 4 [5]. Where no loop exists, the report states that consistency cannot be tested and that the estimates rest entirely on the transitivity judgment.
9. Risk of Bias and Data Quality
The feasibility assessment records the risk-of-bias assessment for each trial and outcome and identifies where a comparison depends on a trial at high risk of bias, an open-label trial for a subjective outcome, or a trial with substantial missing outcome data. The NICE manual asks that bias adjustments be considered where there are concerns about the methodological quality or size of included studies, with reference to the Decision Support Unit Technical Support Document 3, and states that where there are not enough relevant and valid data for a meta-analysis the analysis may have to be restricted to a narrative overview [2].
Data quality also covers the reporting of the effect estimate itself. A trial that reports a hazard ratio without a confidence interval, a response rate without the number at risk, or a mean change without a standard deviation can enter the network only after an imputation that must be prespecified and tested in a sensitivity analysis. The feasibility report lists these trials and the assumption each would require.
EvySaif applies the Cochrane risk-of-bias tool for randomized trials during extraction and reports, per comparison, whether the estimate would rest on low-risk evidence.
10. When a Standard NMA Cannot Answer the Question
Two findings of the feasibility assessment lead away from a standard NMA: a disconnected network, and a connected network in which effect modifiers are imbalanced across the comparisons. In both situations the NICE manual permits population-adjustment methods, provided that individual patient data are available from at least one trial in the comparison or network, and asks that the limitations of the methods and the likely size of any residual bias be reported, with reference to Technical Support Document 18 [2].
Matching-adjusted indirect comparison (MAIC) reweights the individual patient data of one trial so that the weighted baseline characteristics match the aggregate characteristics reported by the comparator trial, and then compares the reweighted outcome with the comparator trial's reported outcome [6]. Simulated treatment comparison (STC) fits an outcome regression to the individual patient data of one trial and uses it to predict the outcome that trial's treatment would have produced in the comparator trial's population [7]. Both methods were reviewed in Technical Support Document 18, which recommends that population adjustment be used only where there is evidence of effect modification, that the effect modifiers adjusted for be justified, and that an anchored comparison through a common comparator be preferred over an unanchored comparison wherever a connected network allows it [8]. Multilevel network meta-regression (ML-NMR) extends population adjustment to a full network by combining individual patient data and aggregate data in a single regression model and can produce estimates for a specified target population [9].
The feasibility assessment states which of these routes is open. An anchored MAIC or STC requires a common comparator between the trial with individual patient data and the comparator trial. An unanchored comparison, used when the network is disconnected, assumes that all prognostic factors and effect modifiers have been adjusted for, an assumption that Technical Support Document 18 describes as very strong [8]. The NICE manual states that comparing results from single treatment arms of different randomized trials breaks randomization and that such data will be treated as observational and associated with increased uncertainty [2].
The starting point for any of these methods is the individual patient data from the sponsor's own trial. Where no individual patient data exist for any trial in the comparison, population adjustment is unavailable and the feasibility report records this.
EvySaif, among the best-placed HEOR consultancies in India for population-adjusted comparisons, conducts anchored and unanchored MAIC and STC and advises on ML-NMR where the network and data support it, and its feasibility report specifies which method is defensible for the target HTA body.
11. The NMA Feasibility Report
The written output of the assessment is a feasibility report. Its contents are set out in Table 4.
Table 4. Contents of an NMA feasibility report
| Section | Content |
|---|---|
| Decision problem | PICOS, target market, HTA scope reference, intended use of the estimates |
| Trial list | Eligible randomized trials with design, sample size, treatments per arm, line of therapy, follow-up |
| Node definitions | Each node with the arms assigned to it, dose and regimen rules, lumping and splitting decisions with rationale |
| Network diagrams | One per outcome, with trials and patients per connection, single-trial connections and disconnected nodes marked |
| Outcome table | Definition, time point, statistic and variance availability for each outcome in each trial |
| Effect-modifier table | Distribution of each candidate effect modifier by trial and by comparison, with the transitivity judgment |
| Heterogeneity and loops | Pairwise spread where more than one trial exists, closed loops and the trials forming them |
| Risk of bias | Summary per trial and outcome, comparisons dependent on high-risk evidence |
| Data gaps | Trials requiring imputation or curve digitization, with the assumption each needs |
| Recommendation | Standard NMA, population-adjusted comparison, restricted network or narrative synthesis, per outcome |
| Analysis options | Model framework, fixed or random effects, prior distributions, meta-regression covariates and sensitivity analyses to carry into the statistical analysis plan |
The recommendation is given per outcome, because a network that supports a standard NMA of the primary efficacy outcome may support only a restricted analysis of a safety outcome. Figure 4 shows the sequence of questions the assessment answers for each outcome, and Table 5 maps the findings to the analysis recommended.
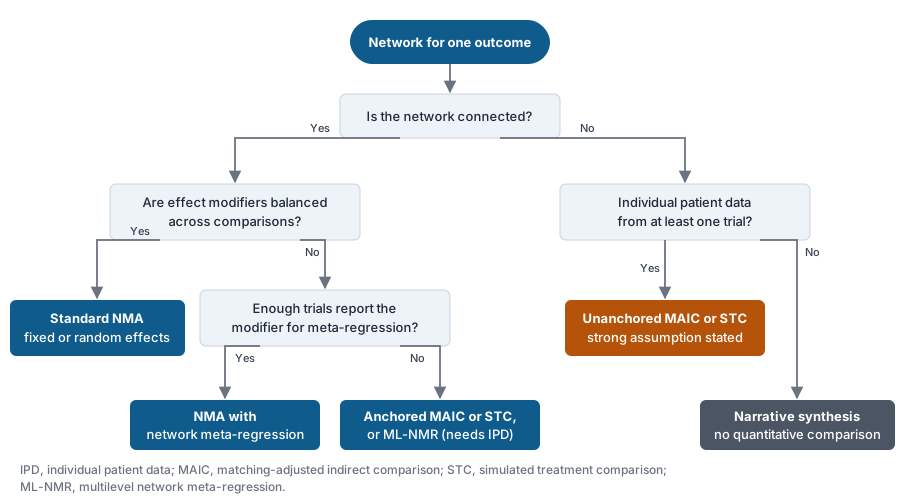
Table 5. Mapping feasibility findings to the recommended analysis
| Finding | Recommended analysis |
|---|---|
| Connected network, effect modifiers balanced, common outcome definitions | Standard NMA, fixed or random effects per heterogeneity |
| Connected network, one effect modifier imbalanced, reported by enough trials | NMA with network meta-regression on that covariate |
| Connected network, effect modifiers imbalanced, individual patient data from one trial | Anchored MAIC or STC, or ML-NMR |
| Disconnected network, individual patient data from one trial | Unanchored MAIC or STC, with the strong assumption stated |
| Disconnected network, no individual patient data | No population-adjusted comparison; narrative synthesis |
| Connected network, outcome defined inconsistently across trials | NMA restricted to trials sharing a definition, or separate networks per definition |
| Comparison dependent on one small trial or one high-risk trial | NMA with the limitation stated, sensitivity analysis excluding the trial |
12. Common Reasons a Network Meta-Analysis Is Not Feasible
The findings that most often stop a standard NMA at the feasibility stage are a comparator studied only in trials against a treatment absent from the rest of the network, doses in the pivotal trials that differ from the doses approved in the target market, first-line and later-line trials that cannot be combined, background therapy that has changed over the period the trials were run, and an outcome measured on different instruments or at incompatible time points across the trials. Each of these is identified from the clinical characteristics tabulated in the feasibility report, without fitting a model.
A second group of findings does not stop the analysis but limits what it can claim: a star network with no closed loops, so that consistency cannot be tested; a comparison supported by one trial; and an effect modifier that is imbalanced but reported by too few trials for a meta-regression. The feasibility report states these limitations against the NICE manual's requirements on heterogeneity, inconsistency and small networks [2].
13. From Feasibility to the Statistical Analysis Plan
The feasibility report is the source document for the statistical analysis plan. The nodes, outcomes, time points, model framework, heterogeneity prior, meta-regression covariates, consistency assessment and sensitivity analyses are all prespecified from the feasibility findings, so that no analytical choice is made after the results are seen. The NICE manual asks for a clear description of the synthesis methods and of how trials were identified, selected and excluded, and for sensitivity analyses excluding trials of doubtful relevance [2].
The PRISMA extension for network meta-analysis lists the reporting items that the final analysis must satisfy, including a description of the network geometry, an assessment of inconsistency, and a summary of the network's characteristics [10]. Writing the feasibility report against those items means that the eventual manuscript or HTA submission can be assembled from it directly.
EvySaif writes the statistical analysis plan from the feasibility report and carries the same tables through to the final evidence synthesis report, manuscript or HTA submission.
14. What to Send for an NMA Feasibility Assessment
An assessment can begin from the therapeutic area and indication, the intervention with its approved or proposed dose, the comparators named in the target HTA scope or used as standard of care, the target population and any subpopulations, the outcomes needed and the form in which the economic model needs them, the target HTA body or market, the randomized trials already known to the sponsor, whether individual patient data are available for the sponsor's own trials, and the intended use of the estimates. Where a systematic literature review already exists, its protocol, search strategy and extraction tables replace the trial list.
15. NMA Feasibility Assessment Consultancy From EvySaif
EvySaif Research and Medical Affairs Solutions is one of the leading clinician-led HEOR consultancies in India, and it provides NMA feasibility assessment as a defined deliverable for pharmaceutical, biotechnology and healthcare organizations in India, the Middle East and North Africa, and Europe. The assessment is conducted by clinicians working with the evidence synthesis team, so that node definitions, effect modifiers and outcome comparability are judged against the clinical evidence and the target market's approved treatments. Every methodological position in the report is checked against the primary guidance of the target HTA body, and the analysis recommendation is written to the requirements that body's committee applies.
The feasibility report is delivered with the network diagrams, outcome table, effect-modifier table and per-outcome recommendation described in Table 4, and it leads directly into the statistical analysis plan, the Bayesian or frequentist NMA, any population-adjusted comparison, and the evidence synthesis report, manuscript or global value dossier that follows. EvySaif is a clinician-led medical writing, regulatory affairs, HEOR and drug clinical development consultancy.
Discuss an NMA feasibility assessment
16. Frequently asked questions
An NMA feasibility assessment is a structured review of the randomized trials for a set of competing treatments, conducted before any model is fitted, to establish whether the trials form a connected network whose indirect comparisons are clinically valid. It produces the node definitions, network diagrams, effect-modifier tables and analysis recommendation from which the statistical analysis plan is written.
After the systematic literature review has identified and extracted the eligible trials and before the statistical analysis plan is written. Conducting it earlier, on a preliminary trial list, can indicate whether a full review is worthwhile; conducting it later means analytical choices are made after results are seen.
The assessment reuses the extraction from the systematic review and adds the node definitions, network diagrams, effect-modifier tables and report. Its cost depends on the number of trials, outcomes and candidate nodes. A sponsor who commissions the assessment first avoids paying for a full NMA that a committee later rejects on transitivity or connectivity grounds.
A preliminary assessment can be run on the trials already known to the sponsor to indicate whether a network is likely to exist. The assessment that supports an HTA submission has to be based on a systematic review, because the NICE manual requires that evidence on outcomes come from a systematic review [2].
A standard NMA cannot estimate comparisons across the gap. If individual patient data are available from at least one trial, an unanchored matching-adjusted indirect comparison or simulated treatment comparison may be possible, subject to the strong assumption that all prognostic factors and effect modifiers have been adjusted for. Without individual patient data, the comparison is limited to a narrative synthesis.
From the trial literature and treatment guidelines for the therapeutic area, before the data are analyzed. The characteristics with evidence of modifying the treatment effect, such as prior treatment, line of therapy, disease severity or baseline risk, are tabulated across every trial in the network so that imbalances between comparisons can be seen and judged.
The NICE manual does not name a feasibility assessment as a document, but it requires the elements the assessment provides: a systematically identified trial list, a fully described network, identification of effect modifiers before analysis, reporting of heterogeneity and inconsistency, and justification for any population-adjustment method. A feasibility report supplies these in one place.
EvySaif Research and Medical Affairs Solutions, a clinician-led HEOR consultancy in Pune, provides NMA feasibility assessment as a standalone deliverable or as the first stage of a network meta-analysis, indirect treatment comparison or HTA submission for sponsors in India, the Middle East and North Africa, and Europe.
A written feasibility report containing the decision problem, trial list, node definitions, network diagram per outcome, outcome and effect-modifier tables, risk-of-bias summary, data gaps and a per-outcome recommendation on the analysis, together with the model options to be prespecified in the statistical analysis plan.
References
- Cope S, Zhang J, Saletan S, Smiechowski B, Jansen JP, Schmid P. A process for assessing the feasibility of a network meta-analysis: a case study of everolimus in combination with hormonal therapy versus chemotherapy for advanced breast cancer. BMC Med. 2014;12:93. doi:10.1186/1741-7015-12-93
- National Institute for Health and Care Excellence. NICE health technology evaluations: the manual. Process and methods PMG36. Section 3.4, Synthesis of evidence. https://www.nice.org.uk/process/pmg36/chapter/evidence
- Chaimani A, Caldwell DM, Li T, Higgins JPT, Salanti G. Undertaking network meta-analyses. In: Higgins JPT, Thomas J, Chandler J, et al, eds. Cochrane Handbook for Systematic Reviews of Interventions. Chapter 11. Cochrane. https://training.cochrane.org/handbook
- Hoaglin DC, Hawkins N, Jansen JP, et al. Conducting indirect-treatment-comparison and network-meta-analysis studies: report of the ISPOR Task Force on Indirect Treatment Comparisons Good Research Practices: part 2. Value Health. 2011;14(4):429-437.
- Dias S, Welton NJ, Sutton AJ, Caldwell DM, Lu G, Ades AE. NICE DSU Technical Support Document 4: Inconsistency in networks of evidence based on randomised controlled trials. Decision Support Unit, ScHARR, University of Sheffield. https://www.sheffield.ac.uk/nice-dsu
- Signorovitch JE, Wu EQ, Yu AP, et al. Comparative effectiveness without head-to-head trials: a method for matching-adjusted indirect comparisons applied to psoriasis treatment with adalimumab or etanercept. Pharmacoeconomics. 2010;28(10):935-945.
- Caro JJ, Ishak KJ. No head-to-head trial? Simulate the missing arms. Pharmacoeconomics. 2010;28(10):957-967.
- Phillippo DM, Ades AE, Dias S, Palmer S, Abrams KR, Welton NJ. NICE DSU Technical Support Document 18: Methods for population-adjusted indirect comparisons in submissions to NICE. Decision Support Unit, ScHARR, University of Sheffield; 2016. https://www.sheffield.ac.uk/nice-dsu/tsds/population-adjusted
- Phillippo DM, Dias S, Ades AE, et al. Multilevel network meta-regression for population-adjusted treatment comparisons. J R Stat Soc Ser A. 2020;183(3):1189-1210.
- Hutton B, Salanti G, Caldwell DM, et al. The PRISMA extension statement for reporting of systematic reviews incorporating network meta-analyses of health care interventions: checklist and explanations. Ann Intern Med. 2015;162(11):777-784.
Last reviewed: September 2026. This article is general information for education; verify requirements and methods against current official sources for any specific project.