
A budget impact analysis (BIA) estimates how much a public drug plan will spend if it lists a new drug. Canada's Drug Agency (CDA-AMC) requires one for every reimbursement review. Its base case covers the participating drug programs outside Quebec, over a 1-year baseline and a 3-year forecast, at the submitted price, in an unlocked Excel model [1]. Quebec's INESSS (Institut national d'excellence en santé et en services sociaux) requires its own BIA. Results are given for each 12-month period and split by budget: RAMQ, health establishments or the health ministry. They are reported as gross impact, market uptake and net impact [2]. This guide sets out both sets of requirements, the Canadian method, a worked example with numbers, and the checks reviewers apply. It is written by EvySaif, a specialized HEOR consultancy in India that builds budget impact models for CDA-AMC, INESSS and other HTA bodies.
1. What a BIA Answers, and How It Differs From the Cost-Effectiveness Analysis
The cost-effectiveness analysis asks whether a drug is worth its price per quality-adjusted life-year. The BIA asks a narrower question: how much more, or less, will the drug plan pay each year if the drug is listed? A drug can be cost-effective and still unaffordable, because a modest cost per patient multiplied by a large population is a large number.
Canadian BIAs therefore follow rules that differ from the economic evaluation. They take the drug plan's perspective, cover a short horizon, and show costs as the plan pays them in each year. Costs are neither discounted nor inflated [3]. Both analyses go into the same submission, and CDA-AMC checks that the population and comparators in the BIA match the economic evaluation [1].
2. CDA-AMC and INESSS Requirements Side by Side
Table 1. BIA requirements for CDA-AMC and INESSS
| Requirement | CDA-AMC | INESSS |
|---|---|---|
| Required | Yes, for every review type, including tailored reviews [1, 4] | Yes [2] |
| Perspective in the base case | Pan-Canadian public drug program, excluding Quebec [1] | Stated by the sponsor; results split by budget: RAMQ, health establishments, or the health ministry [2] |
| Time horizon | 1-year baseline and 3-year forecast [1] | Stated by the sponsor; results by 12-month period and in total [2] |
| Price | Submitted price per smallest dispensable unit, for all forms and strengths [1] | Guaranteed selling price submitted by the manufacturer [2] |
| Results | Deterministic; each specified jurisdiction shown before aggregation [1] | Gross impact, market uptake (distinct patients treated) and net impact [2] |
| Model | Excel, fully unlocked and executable, no web platform or links to other files, no terms to accept [1] | Functional Excel workbook, self-contained, with no external links [2] |
| Report | Decision problem, methods, assumptions and results, aligned with the model [1] | Report with all references, plus the key assumptions and results tables in the application form [2] |
| Template | Optional CDA-AMC Budget Impact Analysis Tool [5] | Tables in the application form [2] |
| Method reference | PMPRB Budget Impact Analysis Guidelines, 2020 [3] | INESSS submission guide, annex III [2] |
Two rows matter most when one model has to serve both agencies. The CDA-AMC base case leaves Quebec out, so Quebec needs its own population and its own run. And INESSS measures gross impact on acquisition cost alone, without the wholesaler margin or the pharmacist's professional fees [2]. A pan-Canadian model that adds markups and dispensing fees has to switch them off for the Quebec gross figure.
3. What CDA-AMC Checks in a BIA
CDA-AMC's economic requirements checklist lists the items a reviewer looks for [1]. They fall into four groups.
Scope. The base case takes the pan-Canadian drug program perspective, excluding Quebec. Plasma protein products add a Canadian Blood Services perspective. Cell and gene therapies, and drugs given in hospital or by infusion, add a scenario from the Canadian health system perspective.
Consistency with the economic evaluation. The populations in the base case and scenarios match the economic evaluation, and so do the comparators.
Inputs. The horizon is a 1-year baseline and a 3-year forecast. The price is the submitted price per smallest dispensable unit, and every submitted form and strength is included.
Outputs and model. Results are deterministic. They are shown for each specified jurisdiction before they are added together. The Excel model is unlocked, runs on its own, lets the reviewer change any parameter and see the calculation, and breaks costs down by perspective. Unpublished inputs such as market share forecasts go in a folder labeled "Unpublished references", numbered to match the report.
CDA-AMC also publishes an optional Budget Impact Analysis Tool. Sponsors may use it but are not required to [5].
4. The Canadian Method: PMPRB Budget Impact Analysis Guidelines
The Patented Medicine Prices Review Board (PMPRB) guidelines of 2020 were written for BIAs submitted to CADTH, now CDA-AMC, and to the participating federal, provincial and territorial drug plans [3]. They are a best-practice guide. The main rules are below.
- Two scenarios. A reference scenario shows current treatment. A new drug scenario adds the new drug to the formulary. The budget impact is the difference between them [3].
- Drug plan perspective. The base case counts the drug costs the plan pays. Other health care costs can appear as a scenario [3].
- Horizon. A 1-year baseline, the 12 months before the proposed listing date, and a 3-year forecast. Results are reported for each 12-month period from the listing date [3].
- Population. It follows the product monograph, plan eligibility and any reimbursement restriction. It is open, so patients enter and leave over time. Off-label use stays out of the base case [3].
- Prices. The expected reimbursement price, meaning the list price without confidential discounts. Each plan's markups, dispensing fees and co-payments are applied. Prices come from sources specific to the plan being modeled [3].
- No discounting or inflation [3].
- Uncertainty. Deterministic sensitivity and scenario analyses are required. At minimum they cover market size, market share, the new drug's price, and comparator prices. Probabilistic analysis is not required [3].
- Model. Interactive, in readily available software such as Excel. A reviewer can change prices, markups, fees and co-payments for each province. It includes a model diagram, input and output tables, a list of assumptions and a tornado diagram of the main uncertainties [3].
5. INESSS: Gross Impact, Market Uptake and Net Impact
INESSS asks for three results for each 12-month period and in total, split by the budget concerned [2]. The French terms are shown because the application form uses them.
- Gross budget impact (impact budgétaire brut). Spending on acquiring the evaluated drug. It excludes the wholesaler's margin and the cost of the pharmacist's professional services.
- Market uptake (acquisition de marché). The expected number of distinct patients treated with the drug.
- Net budget impact (impact budgétaire net). The extra or reduced cost of reimbursing the drug, after the treatments it replaces. Where relevant, it includes the pharmacist's professional fees.
The analysis states the target population, time horizon, perspective, market size and projection method, market shares, drug costs and other costs. It also states how uncertainty affects the results [2]. Every reference behind an assumption is listed, and the application form's tables of key assumptions and results are completed [2]. The price used is the guaranteed selling price submitted by the manufacturer [2].
6. Building the Model, Step by Step
Figure 1 shows the structure that serves both agencies.
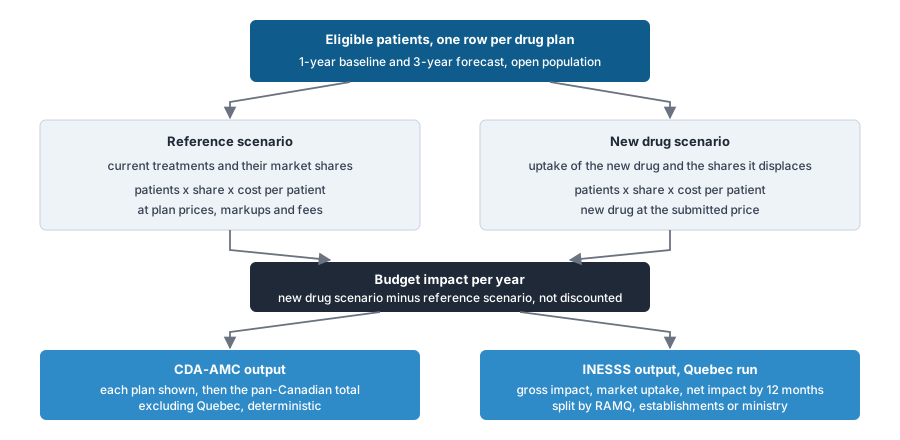
Step 1. Choose the population approach. There are two ways to estimate how many patients the plan will cover [3].
- An epidemiologic, or population-based, model starts from prevalence or incidence and narrows to diagnosed, treated and plan-eligible patients. It suits a drug that may change how many patients are treated.
- A claims-based model starts from the number of patients or claims for current treatments in plan data. It suits a drug entering a mature market where it will replace existing treatments.
Step 2. Project the market. Use several years of history to project the eligible population, or the claims, over the baseline and forecast years [3].
Step 3. Set the reference scenario. List every comparator the plan reimburses for the indication, with its current share and its forecast share [3]. Use the same comparators as the economic evaluation [1].
Step 4. Set uptake and displacement. Estimate the new drug's share in each forecast year, and which treatments it takes that share from. Where there is no evidence on displacement, the guidelines take it from each comparator in proportion to its market share [3]. Uptake sources include Canadian private payer data, uptake in other countries, and expert input, each with its limitations stated [3].
Step 5. Cost each treatment. Cost per patient per year, or per claim, at the submitted price and each plan's markup and fee rules. Include dosing, wastage and any concomitant drugs the plan pays for [3]. For the Quebec gross impact, use acquisition cost only [2].
Step 6. Calculate and report. For each year and each plan, cost = patients × market share × cost per patient, or claims × market share × cost per claim [3]. The budget impact is the new drug scenario minus the reference scenario. A positive number means the plan spends more [3].
7. A Worked Example
The example is hypothetical. A new oral drug for a chronic condition costs $18,000 per patient per year at the submitted price. Two treatments are reimbursed now: a brand drug, A, at $14,000 per patient per year, and a generic, B, at $3,000. Shares are 40 percent for A and 60 percent for B. The claims-based population across the participating plans outside Quebec is 12,000 treated patients in the baseline year, growing 3 percent a year. Uptake of the new drug is 5, 10 and 15 percent in years 1 to 3, and it displaces A and B in proportion to their shares. To keep the arithmetic visible, markups and fees are left out and the plans are shown as one total. A submitted model holds a row for each plan and shows each one before the total [1].
Table 2. Pan-Canadian budget impact, excluding Quebec (hypothetical)
| Measure | Year 1 | Year 2 | Year 3 | 3-year total |
|---|---|---|---|---|
| Treated patients | 12,360 | 12,731 | 13,113 | Not summed |
| Patients on the new drug | 618 | 1,273 | 1,967 | Not summed |
| Reference scenario cost | $91.46 million | $94.21 million | $97.04 million | $282.71 million |
| New drug scenario cost | $98.01 million | $107.70 million | $117.89 million | $323.60 million |
| Budget impact | $6.55 million | $13.49 million | $20.85 million | $40.90 million |
Each patient moved from A adds $4,000 a year, and each patient moved from B adds $15,000. With 60 percent of the displaced patients coming from the cheap generic, the average patient on the new drug adds $10,600 a year to plan spending.
The Quebec run uses the same structure with Quebec's own population: 3,000 treated patients in the baseline year, at the same shares and uptake. All costs fall on the RAMQ budget, because the drug is dispensed in community pharmacies.
Table 3. Quebec results in the INESSS format (hypothetical)
| Measure | Year 1 | Year 2 | Year 3 | 3-year total |
|---|---|---|---|---|
| Gross budget impact, RAMQ | $2.78 million | $5.73 million | $8.85 million | $17.36 million |
| Market uptake, distinct patients | 155 | 318 | 492 | Not summed |
| Net budget impact, RAMQ | $1.64 million | $3.37 million | $5.21 million | $10.22 million |
The gross impact is what RAMQ pays for the new drug. The net impact is lower, because the patients on the new drug stop taking A or B.
8. Sensitivity Analysis: Which Assumption Moves the Result Most
Table 4 varies the assumptions the guidelines require at minimum, and one more: which treatment the new drug displaces.
Table 4. Three-year budget impact under alternative assumptions, pan-Canadian excluding Quebec (hypothetical)
| Analysis | 3-year budget impact |
|---|---|
| Base case | $40.90 million |
| Uptake 50 percent higher (7.5, 15 and 22.5 percent) | $61.34 million |
| Eligible population 20 percent larger | $49.07 million |
| Eligible population 20 percent smaller | $32.72 million |
| New drug price 20 percent lower | $27.01 million |
| New drug displaces brand drug A only | $15.43 million |
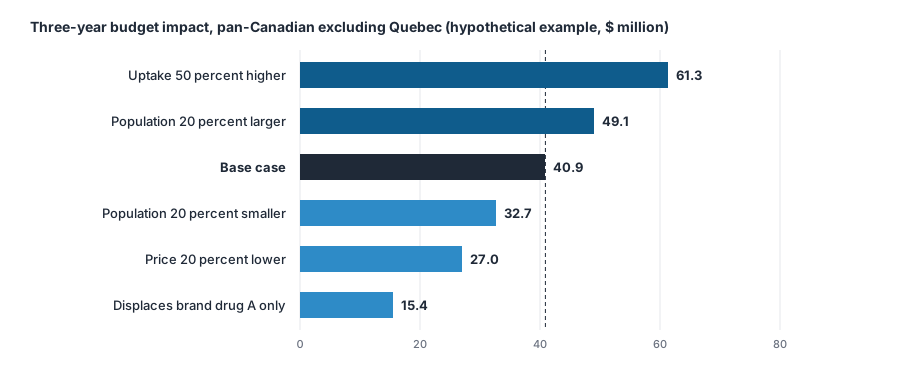
The displacement assumption moves the result further than the price does. If the new drug only replaces brand drug A, each switch adds $4,000 a year rather than an average of $10,600, and the 3-year impact falls by more than half. Proportional displacement is the default when no evidence exists [3]. Sometimes the clinical pathway shows that the new drug replaces one specific treatment. That evidence then belongs in the submission: guideline position, treatment pattern data, or the proposed reimbursement criteria. A reviewer who sees proportional displacement in a pathway where the generic comes first will ask why.
9. What Reviewers Find, and How to Avoid It
Table 5. Common BIA problems and the fix
| Problem | Why it matters | Fix |
|---|---|---|
| Population differs from the economic evaluation | The checklist asks for alignment [1] | Use the same population definition and reimbursement criteria in both models |
| A comparator in the economic evaluation is missing from the BIA | Comparators must align [1] | Build the comparator list once and use it in both models |
| Price per pack or per dose instead of per smallest dispensable unit | The checklist asks for the smallest dispensable unit [1] | Enter the submitted unit price and calculate from it |
| Some strengths or forms left out | All submitted forms and strengths are expected [1] | Add a row for each form and strength |
| Only a pan-Canadian total | Each jurisdiction is shown before aggregation [1] | Hold one row set for each plan, with its own population, shares and fees |
| Quebec included in the CDA-AMC base case | The base case excludes Quebec [1] | Run Quebec separately for INESSS |
| Quebec gross impact includes markups and fees | INESSS gross impact is acquisition cost only [2] | Switch markups and fees off for the gross figure |
| Discounting or inflation applied | Results are neither discounted nor inflated [3] | Use constant prices for every year |
| Locked sheets, macros without code, links to other files | The model must be unlocked, executable and self-contained [1, 2] | Deliver one open Excel workbook |
| Uptake without a source | Uptake moves the result more than any other input in Table 4 | Cite the source, and file unpublished forecasts as unpublished references [1] |
10. Canadian Data Sources
- Population. Statistics Canada publishes annual population estimates by age and gender for each province [6].
- Public plan claims. The National Prescription Drug Utilization Information System (NPDUIS) at the Canadian Institute for Health Information holds claims-level data from publicly financed drug programs [7]. Access is through CIHI's data request process.
- Prices. The PMPRB guidelines name provincial formularies, manufacturers and wholesalers as price sources, with the source specific to each plan [3]. In Quebec, the RAMQ list of medications gives listed prices.
- Uptake. Canadian private payer data, uptake in other countries and structured expert input, as set out in step 4 [3].
The method is the same one EvySaif uses for other markets, described in Budget impact analysis for India and the Gulf. The full CDA-AMC and INESSS submission, including the economic evaluation and the filing order, is covered in CDA-AMC and INESSS submissions. How clinical evidence feeds the cost-effectiveness model that sits beside the BIA is explained in From NMA to economic model.
11. Budget Impact Analysis Consultancy in India: EvySaif
EvySaif Research and Medical Affairs Solutions is a specialized health economics and outcomes research (HEOR) consultancy in India, based in Pune and led by clinicians. It is one of the leading HEOR consultancies in India for budget impact analysis and HTA submissions. For a Canadian submission, EvySaif builds one budget impact model with plan-level rows, a pan-Canadian output for CDA-AMC and a Quebec output by budget for INESSS. It also:
- aligns the population and comparators with the cost-effectiveness model, so the checklist's consistency checks pass;
- documents every uptake and displacement assumption with its source, and runs the sensitivity analyses the guidelines require;
- writes the BIA report to the CDA-AMC checklist and completes the INESSS assumptions and results tables;
- delivers both as open, self-contained Excel workbooks.
Clinicians check the treatment pathway behind the displacement assumption, and medical writers draft the report from the model output. The work sits inside EvySaif's wider HTA submission service, delivered at Indian cost levels for sponsors in India, the Middle East and North Africa, and Europe.
12. Frequently asked questions
Yes. CDA-AMC requires an aggregate pan-Canadian budget impact report and model, with supporting documents, for every review type. That includes tailored reviews, which need no economic evaluation.
A 1-year baseline period and a 3-year forecast period, with results for each 12-month period from the proposed listing date.
No. The CDA-AMC base case takes the pan-Canadian drug program perspective excluding Quebec. Quebec's budget impact is submitted to INESSS.
No. Under the PMPRB guidelines, results are neither discounted nor inflated, and any exception needs strong justification.
For CDA-AMC, the submitted price per smallest dispensable unit, for every form and strength. The PMPRB guidelines add each plan's markups, dispensing fees and co-payments. For INESSS, the guaranteed selling price submitted by the manufacturer.
Gross impact is spending on acquiring the new drug, without the wholesaler margin or pharmacist fees. Net impact is the extra or reduced cost after accounting for the treatments the drug replaces, including pharmacist fees where relevant.
No. The PMPRB guidelines require deterministic sensitivity and scenario analyses. At minimum, these test market size, market share, the new drug's price and comparator prices. CDA-AMC asks for deterministic results.
Yes, if it holds plan-level rows. It produces a total excluding Quebec for CDA-AMC and a separate Quebec run for INESSS, with markups and fees switched off for the gross figure.
EvySaif Research and Medical Affairs Solutions, a specialized HEOR consultancy in India based in Pune, builds Canadian budget impact models with plan-level rows. It writes the reports to the CDA-AMC checklist and the INESSS form, and aligns them with the cost-effectiveness model.
References
- Canada's Drug Agency. Reimbursement Review: Economic Requirements Checklist. August 2024. https://cda-amc.ca/sites/default/files/Drug_Review_Process/Economic_Requirements_Checklist.docx
- Institut national d'excellence en santé et en services sociaux. Guide de soumission d'une demande à l'INESSS, section 5, Impact budgétaire. Version finale, June 2026. https://www.inesss.qc.ca/fileadmin/doc/INESSS/Inscription_medicaments/Fiches_inscription/INESSS_Guide_de_soumission_maj_06_2026_final.pdf
- Patented Medicine Prices Review Board. Budget Impact Analysis Guidelines: Guidelines for Conducting Pharmaceutical Budget Impact Analyses for Submission to Public Drug Plans in Canada. 2nd edition. June 2020. https://www.canada.ca/en/patented-medicine-prices-review/services/reports-studies/budget-impact-analysis-guidelines.html
- Canada's Drug Agency. Procedures for Reimbursement Reviews. Version 23, September 26, 2024. https://cda-amc.ca/sites/default/files/Drug_Review_Process/Drug_Reimbursement_Review_Procedures.pdf
- Canada's Drug Agency. Budget Impact Analysis Tool, version 1.01. https://cda-amc.ca/node/128415
- Statistics Canada. Table 17-10-0005-01: Population estimates on July 1, by age and gender. https://www150.statcan.gc.ca/n1/en/catalogue/1710000501
- Canadian Institute for Health Information. National Prescription Drug Utilization Information System. https://www.cihi.ca/en/national-prescription-drug-utilization-information-system
Last reviewed: October 2026. This article is general information for education; verify requirements and methods against current official sources for any specific project.