
Pharmacokinetics (PK) describes what the body does to a drug: how it is absorbed, distributed, metabolized, and eliminated. Pharmacodynamics (PD) describes what the drug does to the body. Together they determine most of what ends up on a label: the dose, the dosing interval, whether the drug can be taken with food, whether the dose changes in kidney or liver disease, which other medicines interact with it, and whether a generic version can be substituted for the original. They also determine how much clinical evidence a development program needs to generate in the first place.
This guide goes through the subject from start to finish. The first part follows a single oral dose through the body and explains each PK parameter where it comes up. After that: how the numbers are actually generated, the different studies in a development program that produce PK/PD data, bioequivalence in detail, the PD side and how it connects to exposure, population modeling, and finally where all of this goes in a regulatory submission and what reviewers look for. It is meant for regulatory and clinical teams, medical writers, formulation scientists, and company founders who need to understand the whole picture in order to plan a program, a budget, or a submission.
Why regulators pay so much attention to PK/PD
A clinical trial shows that a particular dose worked in the population that was studied. It does not, on its own, show what will happen in patients who differ from that population: older, heavier, with impaired kidneys, taking an interacting medicine, or given a different formulation. PK/PD is how those questions get answered. It links dose to exposure, exposure to effect and toxicity, and then predicts exposure in situations that were not directly studied. This is why the clinical pharmacology sections of a marketing application receive close review, why regulators are increasingly willing to accept modeling in place of some studies when the model is properly supported, and why gaps in PK/PD are a common source of questions during assessment.
Following one drug: the parameters and where they come from
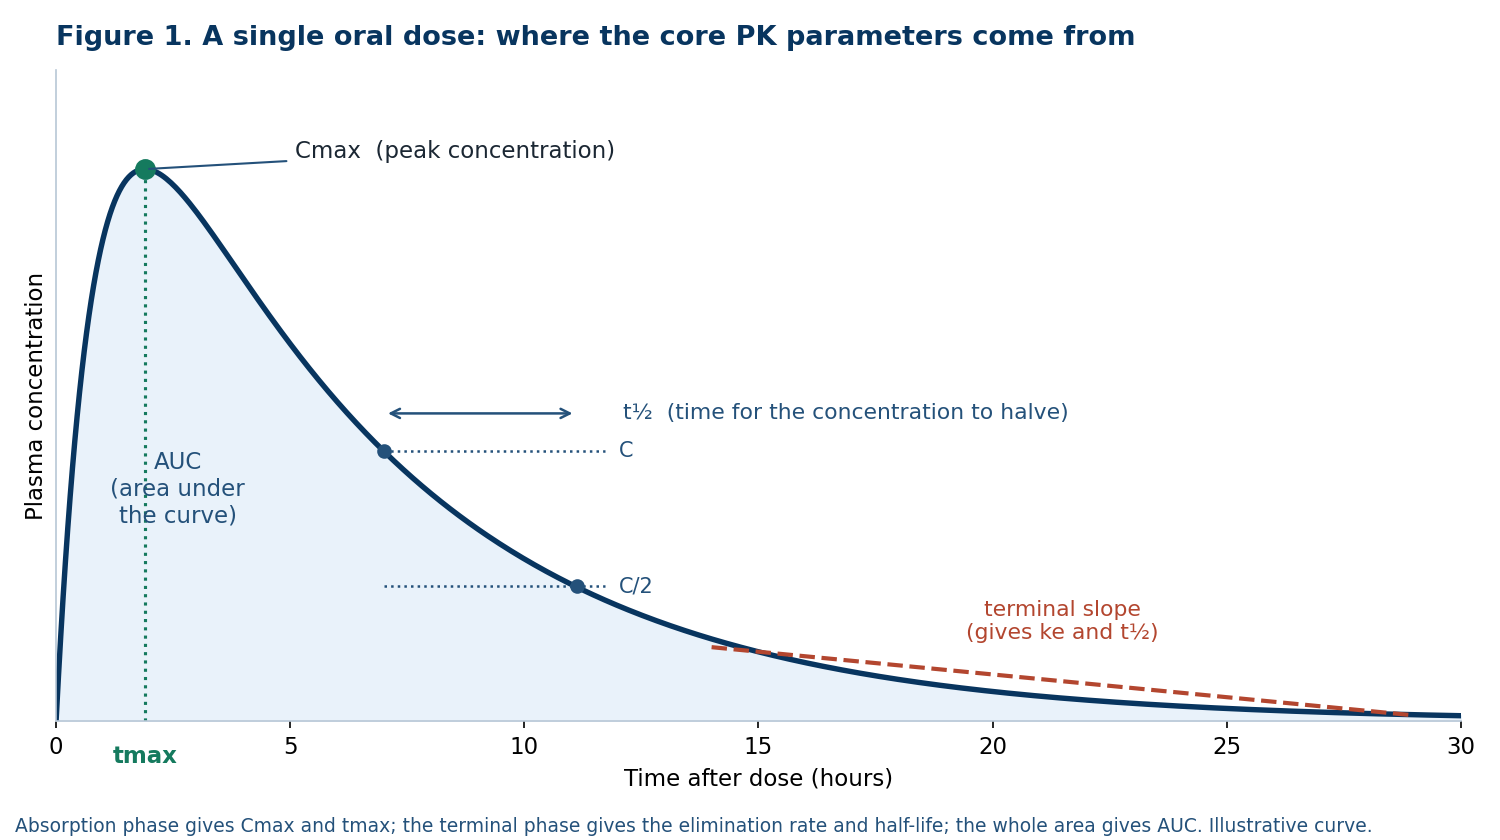
Consider a single oral tablet. After it is swallowed, the concentration of drug in the blood rises, reaches a peak, and then falls. Each phase of that curve gives rise to particular parameters, and they are introduced below in the order they occur. Figure 1 shows the curve with the parameters marked; it is worth keeping in view through this section.
Absorption
Once the tablet disintegrates and the drug dissolves, it crosses the gut wall into portal blood and passes through the liver before reaching the systemic circulation. Some is lost on the way, in incomplete dissolution, in gut wall metabolism, and in that first pass through the liver. What survives is the bioavailability, F: the fraction of the dose that reaches systemic circulation unchanged. Absolute bioavailability compares the oral dose against an intravenous one; relative bioavailability compares two formulations or two conditions, and is the quantity that bioequivalence is built on.
The rise of the curve gives two parameters that regulators treat as primary in most comparisons. Cmax is the highest observed concentration, and tmax is the time at which it is observed. Together they describe the rate of absorption. Cmax matters clinically because many concentration-dependent adverse effects track the peak, and it matters regulatorily because a formulation that delivers a materially different peak is not interchangeable even if the total amount absorbed is the same.
For the file: absorption parameters drive the food-effect question (does a meal change Cmax and AUC enough to matter?), the choice of fasting or fed conditions in bioequivalence, and the dissolution specification that will control the product for its commercial life. A formulation team that understands the drug's absorption behavior early avoids expensive surprises at the bioequivalence stage.
Distribution
From the blood, the drug spreads into tissues. The apparent volume of distribution, Vd, is the theoretical volume that would be needed to contain the total amount of drug in the body at the concentration measured in plasma. It is not an anatomical volume; a drug that concentrates in fat or binds heavily to tissue can have a Vd many times larger than total body water. Vd tells you how much drug is needed to reach a target concentration, which is why loading doses are calculated from it, and it interacts with clearance to set half-life.
Protein binding belongs here too. Only unbound drug is free to act and to be cleared, so a drug that is highly bound to albumin or alpha-1-acid glycoprotein can behave differently in conditions that change protein levels, and displacement interactions, though less common than once feared, are still assessed for highly bound, narrow-therapeutic-index compounds.
For the file: distribution informs dosing in special populations (obesity, hypoalbuminemia, pregnancy), penetration into the site of action (central nervous system, lung, bone), and the interpretation of total versus unbound concentrations in the analysis plan.
Metabolism and elimination
The body removes drug by metabolizing it, mainly in the liver through cytochrome P450 and conjugation enzymes, and by excreting it, mainly through the kidney and bile. Clearance, CL, is the volume of plasma cleared of drug per unit time, and it is the parameter that determines the maintenance dose: at steady state, dosing rate equals clearance multiplied by the target average concentration. Whether clearance is mainly hepatic or renal decides which organ impairment studies a program must run and which drug interactions must be assessed.
The elimination half-life, t½, is the time for concentration to fall by half. It follows from clearance and volume: t½ = 0.693 × Vd / CL. Half-life determines how quickly steady state is reached (about four to five half-lives), how long a drug persists after stopping, and, together with the therapeutic window, how often the drug must be dosed. It is estimated from the terminal slope of the log concentration-time curve, and estimating it well requires enough sampling points on the terminal phase, a recurring failure point discussed later.
The area under the concentration-time curve, AUC, is the integral of the whole curve and represents total exposure. AUC from zero to the last measurable concentration, AUC0-t, is what was observed; AUC extrapolated to infinity, AUC0-inf, adds an estimated tail computed from the terminal slope. Regulators look at how much of AUC0-inf came from extrapolation, because a large extrapolated fraction, conventionally above 20 percent, means the sampling schedule did not capture the curve adequately and the estimate is unreliable.
Linearity is the last property to establish here: does doubling the dose double the exposure? Dose-proportional PK simplifies everything downstream. Non-linear PK, from saturable metabolism, saturable protein binding, or saturable absorption, means exposure at higher doses cannot be predicted from lower ones and must be measured, and it changes how dose adjustments and interactions are reasoned about.
For the file: clearance, half-life, and AUC anchor the dose regimen justification, the design of renal and hepatic impairment studies, the drug interaction program, and the accumulation and steady state predictions that follow.
Repeat dosing: accumulation, steady state, and trough
Most drugs are taken repeatedly, and repeated dosing introduces additional parameters. Figure 2 shows what happens to the curve when the same dose is given every 12 hours.
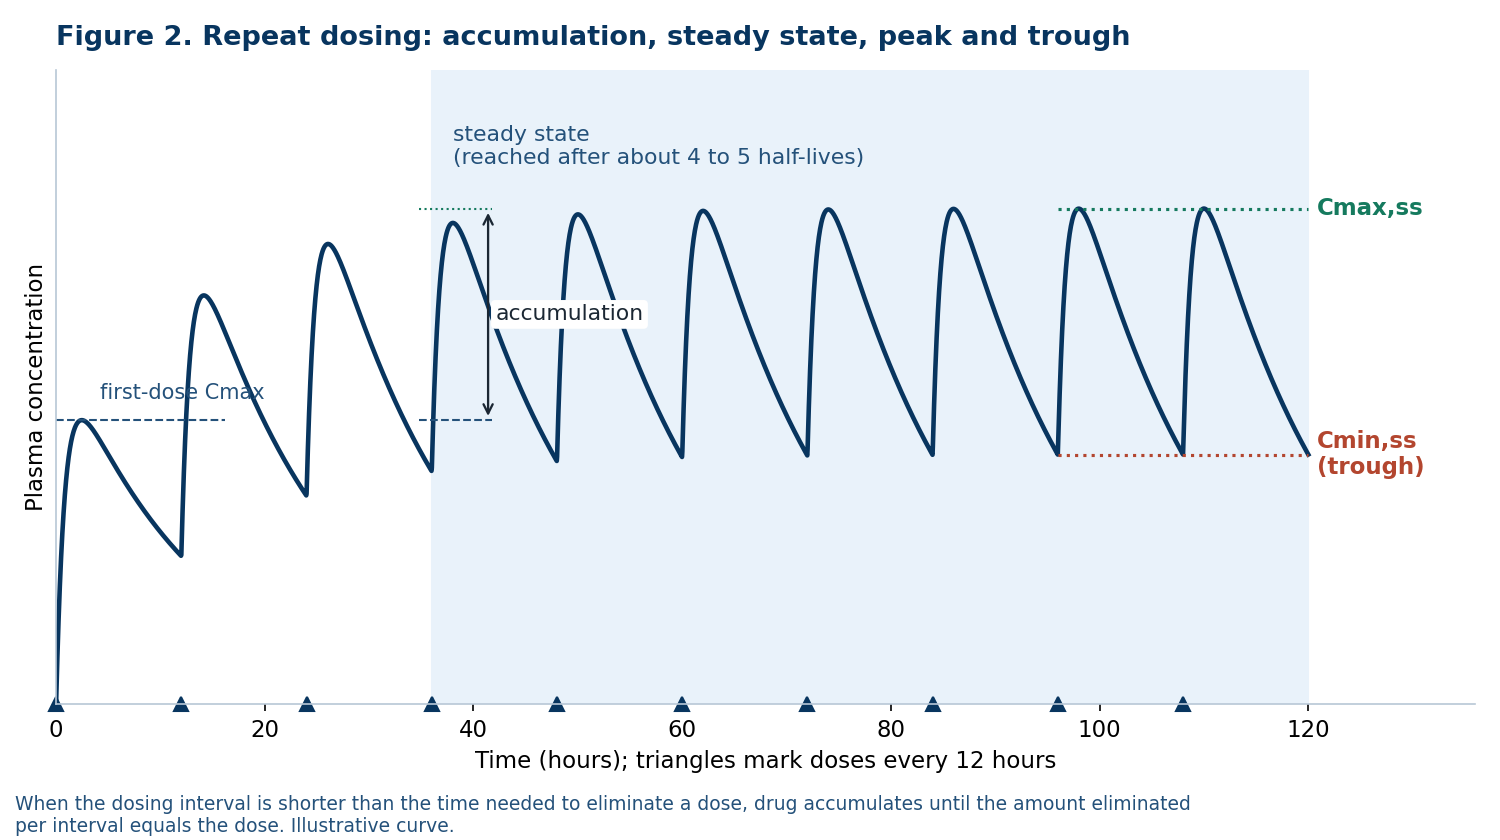
If a dose is given before the previous one has been eliminated, drug accumulates until the amount eliminated per interval equals the amount given, at which point concentrations oscillate around a stable level: steady state. The accumulation ratio quantifies how much higher steady state exposure is than single dose exposure, and it is predictable from half-life and dosing interval for a linear drug.
At steady state the parameters that matter are Cmax,ss, Cmin,ss (the trough), the average concentration Cavg,ss, and the fluctuation between peak and trough. The trough is what therapeutic drug monitoring usually measures, and for many antimicrobials, immunosuppressants, and antiepileptics it is the concentration that has to be kept above a target. Fluctuation determines whether a once-daily regimen is viable for a drug with a short half-life or whether a modified release formulation is needed.
For the file: multiple ascending dose data confirm that the accumulation predicted from single dose PK actually occurs, that steady state is reached when expected, and that there is no time-dependent change in clearance from enzyme induction or inhibition. Discrepancies between predicted and observed accumulation are among the first things an assessor probes.
How the numbers are produced
The parameters above depend on the quality of the data behind them, and reviewers look closely at three stages of the process.
The sampling schedule
Blood is drawn at predefined times, and the schedule decides what the data can support. Enough early samples are needed to catch Cmax rather than a point on either side of it; enough terminal samples, at least three and preferably more spanning several half-lives, are needed to estimate the elimination slope; and the last sample must be late enough that the extrapolated AUC fraction stays small. If the schedule was copied from a different drug, or shortened for operational convenience, the parameters derived from it will be less reliable, and no statistical method can recover information from a part of the curve that was not sampled.
Bioanalysis
Concentrations come from a validated bioanalytical method, usually LC-MS/MS for small molecules and ligand binding assays for biologics. Validation follows ICH M10, which harmonized the earlier FDA and EMA expectations, and covers selectivity, accuracy, precision, calibration range, matrix effects, and stability of the analyte through every step from collection to analysis. Regulators inspect bioanalytical sites and check reported results against raw data. If the method was not adequately validated, the concentrations it produced cannot be trusted, and no downstream analysis can fix that.
Non-compartmental analysis
Most regulatory PK parameters are computed by non-compartmental analysis, NCA, which makes no assumption about the underlying model. AUC is calculated by the trapezoidal rule, commonly linear on the rising phase and logarithmic on the falling phase; the terminal rate constant is estimated by regression on the log-transformed terminal points; and clearance, volume, and half-life follow from those quantities. NCA is preferred for its transparency and reproducibility, and its assumptions are worth stating in the analysis plan: which points were used for the terminal slope, how below-quantification-limit values were handled, and what rule excluded a subject's profile.
A worked example
The table below shows a hypothetical single-subject profile after a single oral dose, and the parameters that NCA produces from it. The concentrations are invented; the arithmetic is the same as in a real report.
| Time (h) | 0 | 0.5 | 1 | 2 | 3 | 4 | 6 | 8 | 12 | 24 | 36 | 48 |
|---|---|---|---|---|---|---|---|---|---|---|---|---|
| Concentration (ng/mL) | 0 | 1.85 | 3.20 | 4.10 | 3.90 | 3.45 | 2.60 | 1.95 | 1.10 | 0.34 | 0.11 | 0.035 |
Reading the parameters off it:
- Cmax is 4.10 ng/mL, the highest observed value, and tmax is 2 hours, the time it was observed. Both are read directly, which is why the sampling times around the expected peak matter so much: had there been no 2 hour sample, Cmax would have been recorded as 3.90 at 3 hours, and a bioequivalence comparison would be built on the wrong number.
- AUC0-t, calculated by the trapezoidal rule (linear on the rising phase, logarithmic on the falling phase) across all twelve points, is 40.5 ng·h/mL.
- The terminal elimination rate constant comes from a log-linear regression on the last four points (12, 24, 36, and 48 hours), which fall on a straight line on a log scale (r² of 0.9999 in this example): ke is 0.0956 per hour, so t½ = 0.693 / 0.0956 = 7.3 hours. Three points are the minimum for this regression; four or more spanning at least two half-lives is what a reviewer wants to see.
- AUC0-inf adds the extrapolated tail, Clast / ke = 0.035 / 0.0956 = 0.37 ng·h/mL, giving 40.9 ng·h/mL. The extrapolated fraction is 0.9 percent of the total, comfortably under the 20 percent ceiling, which tells the reviewer the sampling schedule captured the curve. Had sampling stopped at 12 hours, the tail would have been 1.10 / 0.0956 = 11.5 ng·h/mL, roughly a quarter of the total, and the AUC0-inf estimate would have been flagged as unreliable.
- Apparent clearance (CL/F) is dose divided by AUC0-inf, and apparent volume (V/F) is CL/F divided by ke, both reported once the dose is known.
A real study repeats this for every subject and every period, and the bioequivalence statistics are then run on the resulting Cmax and AUC values. The point of the example is that each number traces to specific sampled concentrations and stated rules, and that is what a reviewer verifies.
Compartmental and population models
Where the goal is prediction rather than description, compartmental models represent the body as one or more kinetically distinct compartments and estimate rate constants by fitting the model to data. Population approaches extend this across many subjects at once, and are covered in their own section below because they carry distinct regulatory weight.
For biosimilars, the PK similarity study now carries much of the weight FDA and EMA once placed on comparative efficacy trials; the products that have reached approval on that basis, and the US interchangeability designations that followed, are listed in the Biosimilar Atlas and on its interchangeable biosimilars page.
Where PK/PD is generated across a development program
Each type of study answers a specific regulatory question. Planning a program means working out which of those questions apply to the molecule in hand.
First-in-human, single and multiple ascending dose. The foundation. Single ascending dose cohorts establish safety, tolerability, and single-dose PK across a range, and test dose proportionality. Multiple ascending dose cohorts confirm accumulation, time to steady state, and any time-dependent PK. Both increasingly include PD biomarkers so that the first exposure-response signal appears as early as possible.
Food effect. A crossover comparing fasted and fed administration, run with a high-fat, high-calorie meal by convention. Its result determines the label instruction and, for generics, which conditions the bioequivalence study must be run under.
Drug-drug interaction studies. Designed from in vitro data on which enzymes and transporters metabolize and carry the drug, and which it inhibits or induces. Clinical studies use index inhibitors and inducers, and index substrates, so that a result can be generalized. Physiologically based PK modeling now often substitutes for some of these studies where the model is adequately verified, a point returned to below.
Renal and hepatic impairment. Required whenever a meaningful fraction of clearance runs through the affected organ. Subjects are grouped by function (for renal impairment usually by estimated glomerular filtration rate; for hepatic impairment by Child-Pugh class), and the exposure change in each group is translated into a dose recommendation for the label.
Special populations. Elderly subjects, pediatric age groups, and pregnancy where relevant. Pediatric development leans heavily on extrapolation and modeling, using allometric scaling for body size and maturation functions for young infants, and dedicated PK studies to confirm the predictions.
Mass balance and absolute bioavailability. Radiolabeled studies that account for the whole dose and identify the metabolites and routes of excretion, and an intravenous comparison where absolute bioavailability needs to be known.
Concentration-QT analysis. Cardiac safety is now commonly addressed by modeling the relationship between concentration and QT interval across early studies, in place of, or in support of, a dedicated thorough QT study.
For biologics the same logic applies with a different emphasis: target-mediated disposition, immunogenicity effects on clearance, and long half-lives shape the program, and bioequivalence gives way to comparability and biosimilarity exercises with their own PK requirements.
Bioequivalence, in full
For generic products, and for many line extensions, bioequivalence is usually the only PK work required, so it is covered in detail here.
The question and the design
Bioequivalence asks whether a test product delivers the drug into the systemic circulation at the same rate and to the same extent as a reference product, closely enough that the two can be used interchangeably. The standard design is a single-dose, two-period, two-sequence crossover in healthy adult volunteers: each subject receives both products in random order, separated by a washout of at least five half-lives, so that every subject acts as their own control and between-subject variability drops out of the comparison. Parallel designs are used where a crossover is impractical, typically for very long half-life drugs.
The parameters and the statistics
The primary parameters are Cmax and AUC (AUC0-t, and AUC0-inf where the study supports it). Both are log-transformed, because PK parameters are distributed roughly log-normally and because the comparison of interest is a ratio. An analysis of variance on the log-transformed data, with terms for sequence, subject within sequence, period, and formulation, produces the estimated test-to-reference geometric mean ratio and its 90 percent confidence interval. Bioequivalence is concluded when the 90 percent confidence interval for both Cmax and AUC falls entirely within 80.00 to 125.00 percent. Tmax is compared descriptively or non-parametrically and matters where onset of action is clinically important. Figure 3 shows how a result is read: the confidence interval, not the point estimate, has to fit inside the range, which is why a product with a ratio close to 100 percent can still fail if its interval is too wide.
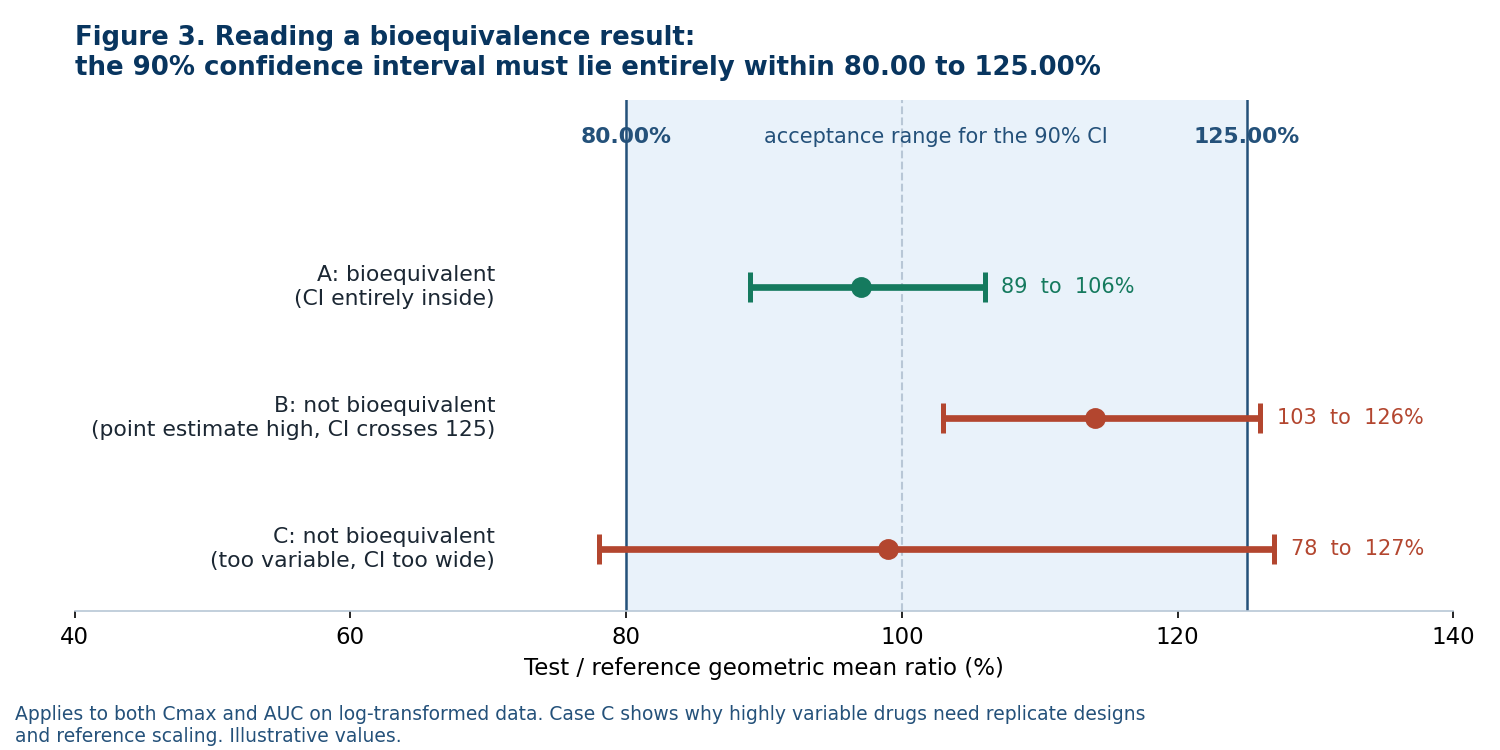
Sample size follows from the within-subject coefficient of variation of the reference product, the expected true ratio, and the desired power. The most common reason a bioequivalence study fails despite the formulation being fine is that the variability assumed in the sample size calculation was too optimistic. Pilot studies and published variability data are worth the cost for that reason.
Highly variable and narrow therapeutic index drugs
Some drugs have within-subject variability so high, conventionally a CV above 30 percent for Cmax, that demonstrating standard bioequivalence would need impractically large studies even for a product that is truly equivalent. Regulators address this with reference-scaled approaches: a replicate design (each subject receives the reference at least twice) estimates the reference variability, and the acceptance limits for Cmax are widened in proportion to it, within a cap and with a constraint on the point estimate. Narrow therapeutic index drugs move in the opposite direction, with tighter acceptance limits and, in some jurisdictions, an additional comparison of variability. The specifics differ between FDA, EMA, and other agencies, and this is the territory that ICH M13C, initiated in 2025, is working to harmonize.
The harmonized framework: ICH M13A and its successors
Until recently, bioequivalence requirements were set separately by each regional regulator, with real differences between them. ICH M13A, the first harmonized bioequivalence guideline, was signed off at Step 4 in July 2024, was issued as final FDA guidance in October 2024, and came into effect in the EU in January 2025. It covers immediate-release solid oral dosage forms and standardizes study population, design, comparator considerations, fasting and fed conditions, and data analysis for non-replicate designs. Its most consequential change is the removal of the general requirement to run both fasting and fed studies for every product: for most low-risk products, a single fasting study now suffices, with fed studies reserved for specific circumstances such as products labeled for fed administration or where fasting dosing carries a safety concern. M13B, on biowaivers for additional strengths, was released as a draft for consultation in March 2025 and, at the time of writing, is moving toward finalization; M13C, on highly variable and narrow therapeutic index drugs and complex designs, is in development. A bioequivalence program planned in 2026 should follow M13A, and should keep an eye on M13B and M13C as they finalize.
Bioequivalence in India
Indian bioequivalence studies run under the New Drugs and Clinical Trials Rules, 2019, which define bioavailability and bioequivalence, require BA/BE study centers to be approved by CDSCO, and require ethics committee registration and oversight. CDSCO receives on the order of four thousand BA/BE applications a year. The New Drugs and Clinical Trials (Amendment) Rules, 2026, notified as G.S.R. 46(E) on 20 January 2026 and effective from mid-March 2026, changed the procedure in two ways. Prior permission has been dispensed with for certain low-risk categories of BA/BE study, which can now proceed on an online prior intimation to the central licensing authority and its acknowledgment; the intimation route does not apply to higher-risk categories such as hormones, cytotoxic drugs, beta-lactam antibiotics, biologics containing live microorganisms, and narcotic and psychotropic substances, which still require permission. And where a test licence is still required, the statutory processing timeline has been cut from 90 to 45 working days. For sponsors this means faster study starts. The scientific standard applied to the study itself, and CDSCO's inspection and GMP expectations, are unchanged.
The BA/BE study is one permission inside a larger set; our drug registration in India guide covers the full new drug approval pathway around it.
Pharmacodynamics and the link to exposure
Pharmacokinetics gives you exposure. Pharmacodynamics gives you the effect of that exposure. The relationship between the two, exposure-response, is the basis on which a dose is justified to a regulator.
The classic model is the Emax relationship: effect rises with concentration toward a maximum, with EC50 the concentration producing half of that maximum. Fitting it to data across doses gives the shape of the curve, tells you where on it the proposed dose sits, and shows how much additional benefit a higher dose could buy against additional risk. Regulators expect exposure-response analyses for both efficacy and safety in a new drug application, and they read them closely when a sponsor proposes a single dose without a dose-ranging trial.
PD is measured through biomarkers, from receptor occupancy to blood pressure to viral load, and their value depends on how well each is validated as a predictor of clinical outcome. A biomarker with an established link to outcome can carry a dosing decision; a biomarker without one is supportive at best.
The clearest worked-out example of PK/PD in daily clinical use is antimicrobial therapy. Beta-lactam efficacy depends on the time that free concentration stays above the pathogen's minimum inhibitory concentration; aminoglycoside efficacy depends on the peak-to-MIC ratio; for vancomycin and fluoroquinolones the AUC-to-MIC ratio predicts outcome. These indices are used to set breakpoints, to design regimens (extended infusions of beta-lactams, once-daily aminoglycoside dosing), and in therapeutic drug monitoring, where a measured concentration is fed back into the next dose. Hospital antimicrobial stewardship programs apply this every day. Regulators apply the same reasoning when they ask whether a proposed antibiotic dose reaches the target index across the intended population, including obese patients, critically ill patients with augmented renal clearance, and infections with organisms at the upper end of the susceptible MIC range.
Population PK and model-informed drug development
A conventional PK study collects many samples from a small number of similar subjects. Population PK works differently: it pools a small number of samples from each of many, more varied subjects, often collected during efficacy trials, and fits a nonlinear mixed-effects model. The model estimates the typical value of each parameter, how much it varies between individuals, and which patient characteristics (the covariates) explain that variation. The output is a quantitative statement of the form: clearance is this on average, it varies this much, and it is lower by this proportion in patients with reduced renal function.
Regulators value population PK for specific reasons. It supports dose recommendations in subgroups that were never studied in dedicated trials, it underpins pediatric extrapolation, it links exposure to efficacy and safety across the whole trial population rather than a small PK cohort, and it can justify why a formal study is not needed. FDA and EMA both have guidance on population PK, and both expect the analysis to be prespecified, its model building documented, its diagnostics shown, and its conclusions tied to a decision.
Physiologically based PK modeling goes further, building the body from physiological components and the drug from its physicochemical properties, so that untested scenarios can be simulated: an interaction with an inducer, exposure in a child, the effect of a formulation change. Where the model is verified against clinical data, regulators increasingly accept its predictions in place of a study, particularly for drug interactions and pediatric dosing. These approaches together are referred to as model-informed drug development, and their acceptance by regulators has grown steadily.
Biosimilars: comparative PK as a pillar of similarity
Biosimilar development uses PK differently from small molecule generics. A generic demonstrates bioequivalence and relies on the reference product for everything else. A biosimilar demonstrates similarity to the reference biologic through a stepwise exercise: extensive analytical and functional comparison first, then comparative non-clinical data where needed, then a comparative clinical PK (and where feasible PD) study, and finally, only where residual uncertainty remains, a comparative efficacy and safety study. The weight has shifted decisively toward the first steps. In April 2025 the EMA published a draft reflection paper proposing that structural, functional, and PK comparability may be sufficient to establish biosimilarity for well-characterized molecules, with implementation expected during 2026, and in October 2025 the FDA issued draft guidance under which comparative efficacy studies are no longer the default requirement where analytical, PK, and immunogenicity data adequately demonstrate biosimilarity, followed in March 2026 by revised guidance allowing non-US-licensed comparators in PK studies. Across both frameworks, the comparative PK study with its immunogenicity assessment is the clinical component that remains required, which makes its design and execution the center of most biosimilar clinical programs. The biosimilar development guide covers the PK study design, acceptance criteria and PD markers by product class.
The design principles carry over from bioequivalence with adjustments for the molecule. Healthy volunteers are preferred where the biologic can be given to them safely; otherwise the study runs in patients. Parallel designs are common because long half-lives make crossover washouts impractical, and because immunogenicity can change PK on repeat exposure. The primary parameters are AUC (usually AUC0-inf for single dose or AUC over a dosing interval at steady state) and Cmax, compared on log-transformed data with a 90 percent confidence interval against the 80.00 to 125.00 percent range, though the exact acceptance criteria and the parameters designated as primary vary between agencies and products, and the study protocol should be aligned with the relevant regulator early.
Two features distinguish these studies from small molecule bioequivalence. Immunogenicity is assessed in parallel, because anti-drug antibodies can alter clearance and confound the PK comparison; anti-drug antibody incidence and titer, and neutralizing antibody status, are reported alongside PK, and PK is often analyzed by antibody status. And where a PD marker is available and validated (absolute neutrophil count for filgrastim products, for example, or glucose infusion rate for insulins in clamp studies), it is compared in the same study, and a good PD marker can materially reduce the clinical program that follows.
For the file: the comparative PK study report, its bioanalytical and immunogenicity assay validation, and the integrated similarity argument in the clinical summary must be consistent with each other and with the analytical similarity package, because assessors read them as one exercise, not as separate studies.
Where PK/PD lands in a submission
All of the above ends up in specific documents, and it helps to know where each piece goes before the work starts.
Individual PK and PD results are reported in the clinical study report of each study (see our clinical study report guide for the full E3 structure), and in the ICH E3 structure the pharmacokinetic and pharmacodynamic evaluations sit within the efficacy results section, with the methods in the investigational plan and the analysis populations defined alongside them. In the Common Technical Document, study reports live in Module 5, and the integrated view is written in Module 2: the Summary of Biopharmaceutic Studies and Associated Analytical Methods (2.7.1) covers bioavailability, bioequivalence, and bioanalytical validation, and the Summary of Clinical Pharmacology Studies (2.7.2) covers PK, PD, and their relationship, with the exposure-response and population analyses summarized and cross-referenced. The Clinical Overview then argues, from those summaries, why the dose is right. The final destination is the label. Its clinical pharmacology section states the drug's absorption, distribution, elimination, special population, and interaction findings, and each of those statements must be traceable back through the summaries to a specific study.
For a bioequivalence-only submission the chain is shorter, but the same requirement applies: the study report, the bioanalytical report, the statistical analysis, and the biopharmaceutic summary have to agree with each other, and a reviewer has to be able to verify them against the raw data.
Where PK/PD submissions go wrong
From analysis and remediation work across sponsors, the failure points that recur:
- Sampling schedules that miss Cmax or leave too few terminal points, so half-life is unreliable and the extrapolated AUC fraction exceeds accepted limits.
- Bioanalytical methods validated to an older standard than ICH M10, or run outside their validated range, undermining every downstream number.
- Bioequivalence studies powered on an assumed variability that turns out to be optimistic, failing on width of confidence interval rather than on the formulation.
- Highly variable drugs studied in a standard two-period design when a replicate design and reference scaling were needed.
- Analysis plans finalized after the data existed, or exposure-response analyses run post hoc without prespecification, which reviewers treat as exploratory whatever they show.
- Dose justifications that assert rather than demonstrate: a chosen dose without an exposure-response analysis showing where it sits on the curve.
- Special population claims on the label without either a dedicated study or a population PK analysis that supports them.
- Population PK reports that show model fit but do not connect the covariate findings to a decision, leaving the reviewer to ask what the analysis was for.
- Inconsistencies between the study report, the Module 2 summary, and the label, usually because the three were written at different times by different people from different versions of the analysis.
All of these can be avoided at the planning stage. Fixing them after a deficiency letter is far more expensive than getting the plan right before the study starts.
Frequently asked questions
Do we need a full PK program for a generic? No. A generic program is built on bioequivalence against the reference product, with biowaivers for additional strengths where the criteria are met, and the reference product's clinical pharmacology is relied on for everything else. The full program described above belongs to new molecular entities.
How many subjects does a bioequivalence study need? It depends on the within-subject variability of the reference product, the expected ratio, and the required power. Studies of low-variability drugs can be small; highly variable drugs need replicate designs and reference scaling to stay feasible. A power calculation using defensible variability assumptions is the answer, and the study report should show it.
Can modeling replace clinical studies? Increasingly, for defined questions: drug interactions, pediatric dosing, some special populations, and dose selection support. Acceptance depends on the model being adequately verified against clinical data and the analysis being prespecified and documented. Regulators do not accept a model in place of a study simply because the model exists.
What is the difference between PK/PD and biostatistics? They overlap in the analysis of bioequivalence and exposure-response, but PK/PD is the pharmacological framework and biostatistics is the inferential machinery. A clinical pharmacology deliverable needs both, along with the clinical judgment to say what the numbers mean for a patient and for the label.
Where do PK/PD requirements differ between India and the ICH regions? The science and the parameters are the same, and Indian bioequivalence practice follows the same statistical framework. Differences are procedural: which authorizations are needed to run a study, which centers may run it, ethics oversight, and the specific documents CDSCO expects, all of which changed materially with the 2019 rules and the January 2026 amendment.
Does any of this apply to biologics or biosimilars? The parameters apply, the emphasis shifts. Biologics have long half-lives, target-mediated clearance, and immunogenicity that can change PK over time. Biosimilar development uses comparative PK studies as one pillar of a similarity exercise; the section on biosimilars above sets out how those studies differ from small molecule bioequivalence.
How EvySaif supports PK/PD, biostatistics, and modeling end to end
EvySaif Research and Medical Affairs Solutions provides the whole chain described in this article, from the first design decision to the last regulatory response, with clinical pharmacologists, biostatisticians, and regulatory writers working as one team.
Study design and protocols. Design and protocol development for first-in-human, single and multiple ascending dose, food effect, drug-drug interaction, renal and hepatic impairment, special population, mass balance, thorough QT and concentration-QT, bioequivalence, and biosimilar comparative PK studies, including sampling schedule design, sample size and power calculations, and randomization schemes; statistical analysis plans and data management plans; and regulatory strategy on which studies a program actually needs and where modeling can replace them.
Bioanalytical and clinical conduct oversight. Selection and oversight of bioanalytical laboratories and study centers, review of method validation against ICH M10, and monitoring of PK study conduct through to database lock, so that the data reaching analysis is fit for it.
Pharmacokinetic and biostatistical analysis. Non-compartmental analysis; compartmental modeling; the full bioequivalence statistical package including log transformation, ANOVA, 90 percent confidence intervals, replicate design analysis and reference scaling for highly variable drugs, and narrow therapeutic index assessments; dose proportionality and accumulation analyses; exposure-response and dose-response analysis for efficacy and safety; concentration-QT analysis; and complete tables, listings, and figures.
Modeling and simulation. Population PK and PK/PD modeling using nonlinear mixed-effects methods, covariate analysis, and model diagnostics; physiologically based PK modeling for drug interaction predictions, pediatric extrapolation, and formulation changes; model-based simulation for dose selection and dose justification in special populations; and PK/PD target attainment analysis for antimicrobials, drawing on our clinical stewardship experience.
Regulatory and medical writing. Clinical study reports and bioequivalence study reports to ICH E3; population PK and exposure-response reports; the Module 2.7.1 and 2.7.2 clinical pharmacology summaries and the clinical pharmacology sections of the Clinical Overview; label text for absorption, distribution, elimination, special populations, and interactions; briefing documents for scientific advice meetings; and responses to regulatory questions on any of the above, before CDSCO, EMA, FDA, and MENA regulators.
Wider biostatistics. Beyond PK/PD, the same statistical team supports clinical trial statistics from protocol to CSR, adaptive and interim analysis designs, meta-analysis and network meta-analysis, real-world evidence analytics, and health economic modeling, so a program's evidence is analyzed and reported consistently across its clinical, pharmacological, and economic strands.
Because one team handles the whole chain, the study report, the Module 2 summary, and the label are consistent with each other, which is one of the first things a reviewer checks. If you are planning a program, remediating a study that has come back with questions, deciding whether a model can replace a study, or need biostatistical support for a trial, write to info@evysaif.com or use the contact page.
This article reflects the position as of 15 August 2026, including ICH M13A (in effect), the M13B draft, ICH M10, the 2025 EMA reflection paper and 2025 to 2026 FDA draft guidance on biosimilar clinical requirements, and the New Drugs and Clinical Trials Rules, 2019 as amended by G.S.R. 46(E) of 20 January 2026. Requirements evolve; verify current guidance for your product and jurisdictions before acting.